IMAGE

Figure 3.

ID
ZDB-IMAGE-200912-11
Source
Figures for Wragg et al., 2020
Image
Figure Caption

Figure 3.

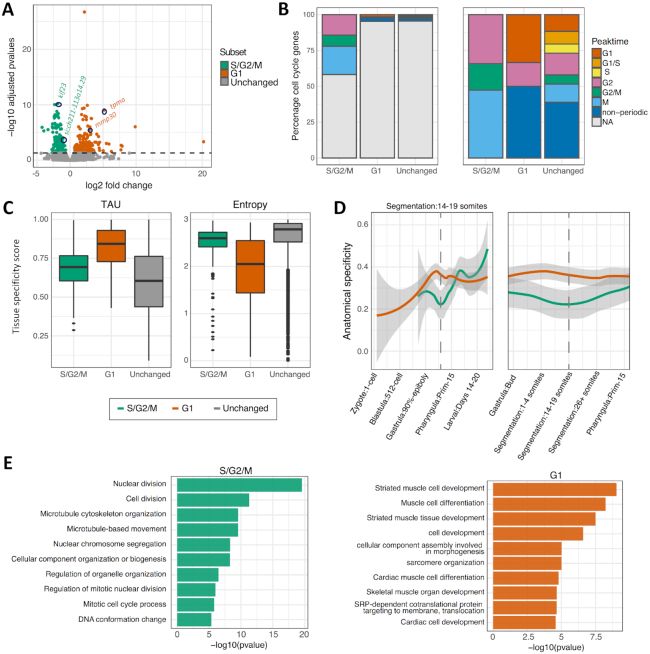
Classification of genes differentially expressed between G1 and S/G2/M segregated cells. (A) Volcano plot of all consensus clusters (CCs) in known promoter regions, coloured by significance. Location of genes shown in Figure 2B as well as the identity of top significant differentially expressed genes between populations highlighted by circles and gene names. (B) Bar plot of the percentage of promoters overlapping a human annotated cell cycle periodic gene from Cyclebase for each differentially expressed group and the CCs unchanged between the two groups. Left panel, full sample groups (n = 138, 190 and 8406, S/G2/M, G1 and unchanged respectively). Right panel, cell cycle periodic genes (n = 43, 6 and 246, S/G2/M, G1 and unchanged respectively). (C) Box plot of tissue specificity scores, based on adult zebrafish tissue for genes upregulated in G1 and S/G2/M and unchanged. (D) Anatomical specificity scores, based on expression in embryonic zebrafish tissues, for genes upregulated in G1 and S/G2/M. Left panel, anatomical specificity scores across development with key stages marked on x-axis. Right panel, anatomical specificity scores around stage at which the samples were collected (14-somite). Grey shading marks standard error, dashed line marks 14–19 somite stage. (E) Gene ontology of biological processes with their corresponding P-values.

Acknowledgments
This image is the copyrighted work of the attributed author or publisher, and ZFIN has permission only to display this image to its users. Additional permissions should be obtained from the applicable author or publisher of the image. Full text @ Nucleic Acids Res.