IMAGE

Figure 4

ID
ZDB-IMAGE-200910-5
Source
Figures for Naert et al., 2020
Image
Figure Caption

Figure 4

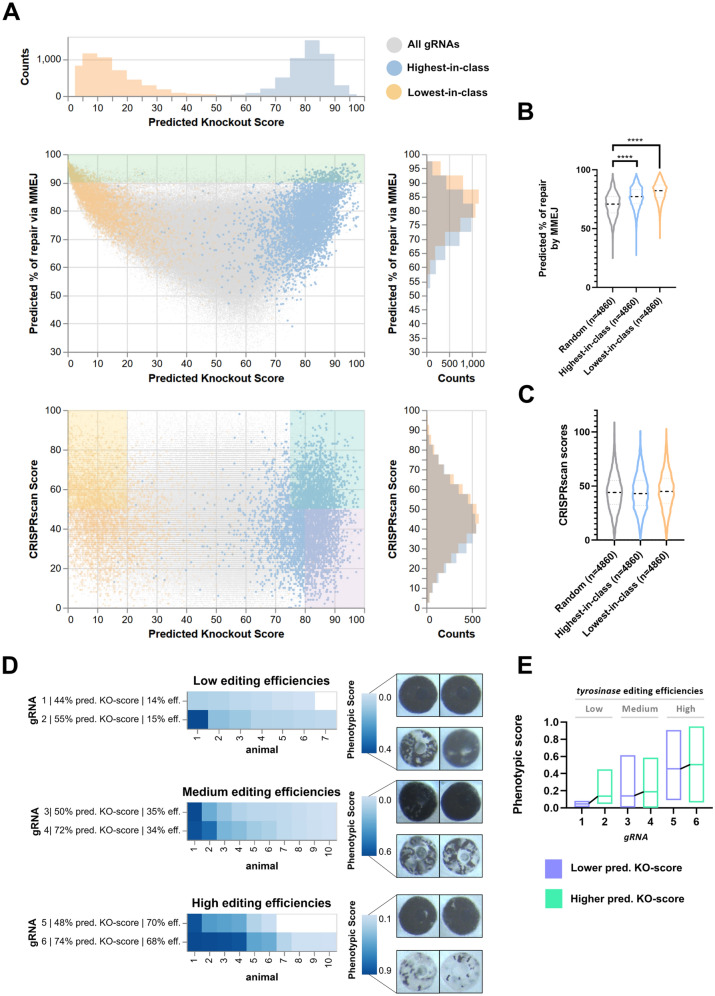
Integrating CRISPRscan and the InDelphi-mESC model allows identification of efficient high frameshift frequency gRNAs in X. tropicalis. (A) Scatterplot with marginal histograms demonstrating for 339,693 gRNAs across the coding sequence for 4,860 X. tropicalis genes the relationships between calculated CRISPRscan score, InDelphi-mESC predicted frequency of MMEJ repair and InDelphi-mESC predicted knockout-score (KO-score). KO-score is defined as the predicted percentage of cells with biallelic out-of-frame mutations within the pool of all mutant cells (i.e. in-frame and out-of-frame; mono- and bi-allelic) in the mosaic mutant embryo and is calculated as the square of the frameshift frequency predicted by InDelphi-mESC. For each gene (n = 4,860), the gRNA with the highest predicted KO-score (Highest-in-class) is highlighted in blue, while the gRNA with the lowest predicted KO-score (Lowest-in-class) is highlighted in orange. Demarcations illustrate those quadrants where gRNAs suffice to certain cutoff thresholds. Ideally, designed gRNAs fall within the aquamarine demarcation (high predicted KO-score, high CRISPRscan score), but not the orange (low predicted KO-score, high CRISPRscan score) or purple demarcation (high predicted KO-score, low predicted CRISPRscan score). (B) Violin plot illustrating that highest-in-class gRNAs and lowest-in-class gRNAs have a higher predicted percentage of repair by microhomology-mediated end joining than a random selection of guides. (****p < 0.001—Table S2). (C) No distinct difference in calculated CRISPRscan scores between highest-in-class gRNAs, lowest-in-class gRNAs and a random selection of gRNAs. (D) Comparison of three pairs of gRNAs targeting the second exon of the tyrosinase gene responsible for pigmentation in X. tropicalis. As these three pairs of guides have very similar genome editing efficiencies, as determined by targeted amplicon sequencing, the impact of differential predicted KO-scores on phenotypic penetrance is revealed. (D, E) Phenotypic scoring is based on retinal pigmentation at Nieuwkoop-Faber stage 38 and a trend is observed where guides with higher predicted KO-scores yield a higher phenotypic score under very similar genome editing efficiencies.

Acknowledgments
This image is the copyrighted work of the attributed author or publisher, and ZFIN has permission only to display this image to its users. Additional permissions should be obtained from the applicable author or publisher of the image. Full text @ Sci. Rep.