IMAGE

Figure 3

ID
ZDB-IMAGE-200910-4
Source
Figures for Naert et al., 2020
Image
Figure Caption

Figure 3

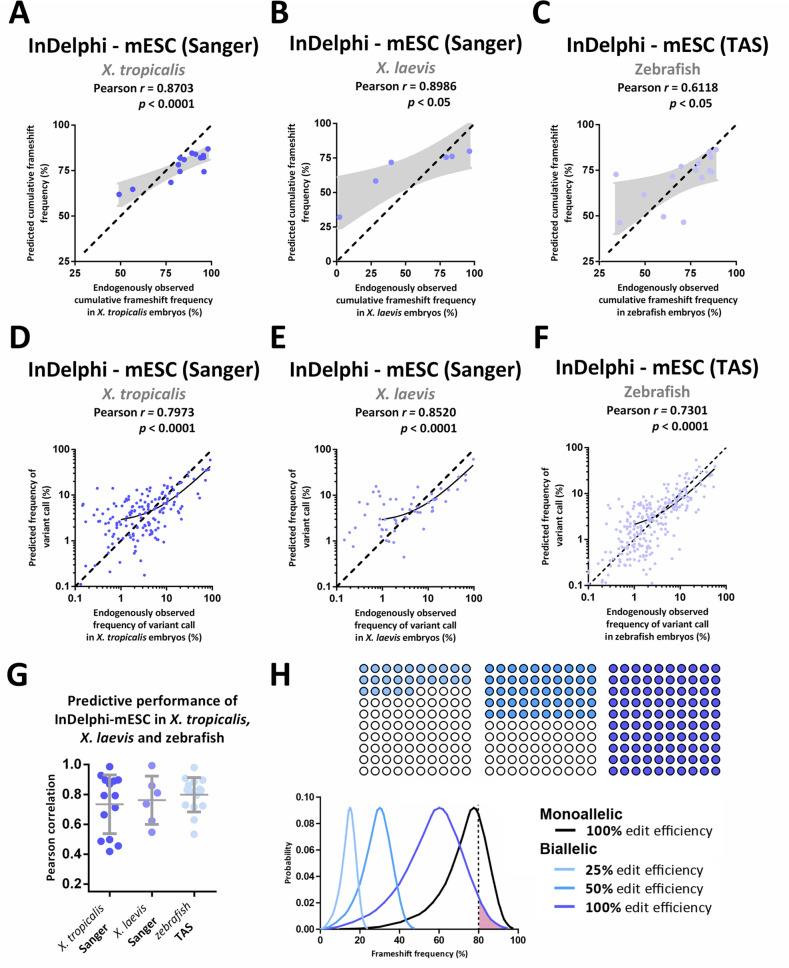
The InDelphi-mESC model accurately predicts CRISPR/Cas9 gene editing outcomes in X. tropicalis, X. laevis and zebrafish embryos which can be exploited to identify high-frameshift frequency gRNAs. (AF) Scatter plot with InDelphi-mESC-predicted cumulative frameshift gene editing frequencies correlated to experimentally observed cumulative frameshift gene editing frequencies, for each sgRNA separately, in X. tropicalis (n = 14) (Panel A), in X. laevis (n = 6) (Panel B) and in zebrafish (n = 15) embryos (Panel C). Scatter plot with InDelphi-mESC-predicted INDEL patterns correlated to experimentally observed INDEL patterns, for all gRNAs simultaneous, in X. tropicalis (n = 14) (Panel D), in X. laevis (n = 6) (Panel E) and zebrafish (n = 15) (Panel F) embryos. Black demarcated lines show the perfect correlation r = 1. Light-grey areas show the standard error on the best-fit linear regression line. Black lines show linear regression model. (G) Correlations between model-predicted INDEL patterns to experimentally observed INDEL patterns, for each gRNA separately. Correlations for X. tropicalis embryos (n = 14) (dark blue) and X. laevis embryos (n = 6) (middle blue) analyzed by Sanger sequencing and sequence trace decomposition. Correlations for zebrafish embryos analyzed by targeted amplicon sequencing (TAS) (n = 15) (light blue). (H) Using the distribution of the expected probability of frameshift frequency for a large dataset of SpCas9 human target sites in mESC cells from Shen et al. 2018 (black line—monoallelic)27, we draw the derivative distribution of the probability of a randomly designed gRNA to generate biallelic frameshift editing. This distribution is shown for different editing efficiencies within the F0 mosaic animal: 100%, 50% and 25% (in reducing intensities of blue—100 circles, each circle represents a cell within a total mosaic of a 100 cells). E.g. The probability of a randomly designed gRNA to yield more than 80% biallelic frameshift mutant cells in a developing mosaic, assuming 100% efficiency, is the area under curve highlighted in pink and represents only a 3.24% probability.

Acknowledgments
This image is the copyrighted work of the attributed author or publisher, and ZFIN has permission only to display this image to its users. Additional permissions should be obtained from the applicable author or publisher of the image. Full text @ Sci. Rep.