IMAGE

Figure 2

ID
ZDB-IMAGE-200910-3
Source
Figures for Naert et al., 2020
Image
Figure Caption

Figure 2

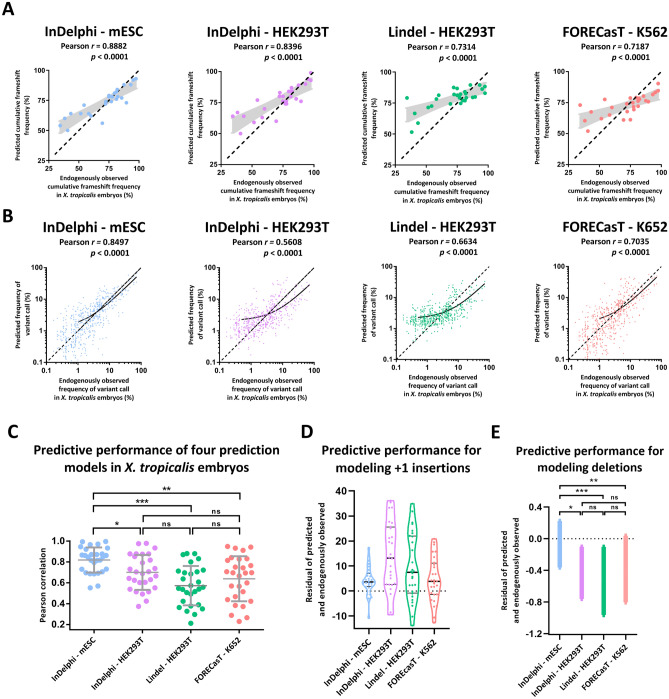
The InDelphi prediction model, trained in mESC cells, accurately predicts CRISPR/Cas9 gene editing outcomes and outperforms several other prediction models in X. tropicalis embryos. (A) Scatter plot with model-predicted cumulative frameshift gene editing frequencies correlated to experimentally observed cumulative frameshift gene editing frequencies, for each sgRNA (n = 28) separately, in X. tropicalis embryos. Black demarcated lines show the perfect correlation r = 1. Light-grey shows the standard error of the best-fit linear regression line. (B) Scatter plot with model-predicted INDEL patterns correlated to experimentally observed INDEL patterns, for all gRNAs simultaneously. Black lines show linear regression models of all correlations. Black demarcated lines show the perfect correlation r = 1. (C) Correlations between model-predicted and experimentally observed INDEL patterns, for each gRNA separately. Error bars represent mean ± SD. (***p < 0.001; **p < 0.01; *p < 0.05; ns = not significant; Shapiro–Wilk (p > 0.05); Levene (p < 0.05); One-way Welsh ANOVA to adjust for unequal variances (p < 0.001), with Games-Howell multiple comparisons) (Table S2). (D) Violin plots of the residuals (predicted frequency—observed frequency) between model-predicted and experimentally observed frequency of + 1 insertion gene editing outcome. (E) The SEM of the mean residual difference (predicted frequency—observed frequency) between model-predicted and experimentally observed frequency of all deletion variants modeled.

Acknowledgments
This image is the copyrighted work of the attributed author or publisher, and ZFIN has permission only to display this image to its users. Additional permissions should be obtained from the applicable author or publisher of the image. Full text @ Sci. Rep.