IMAGE

Fig. 3.

ID
ZDB-IMAGE-200910-20
Source
Figures for Oppel et al., 2020
Image
Figure Caption

Fig. 3.

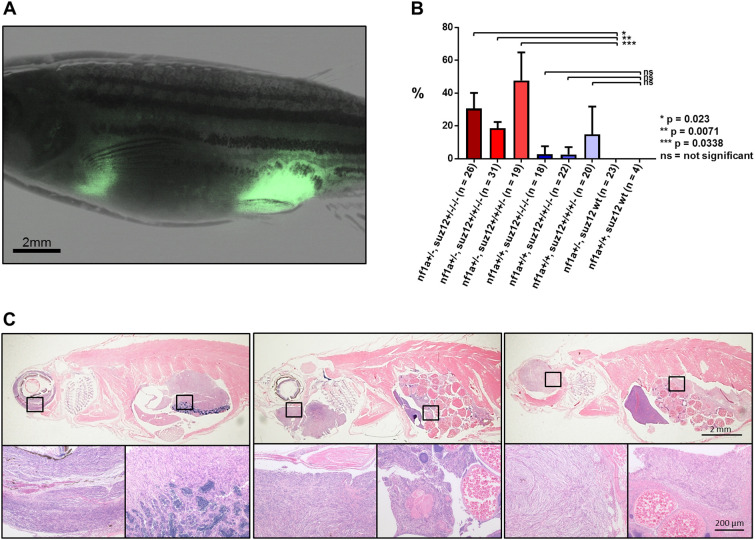
Observation of multiple tumor foci in p53/nf1/suz12-deficient zebrafish lines. (A) Fluorescence microscopy image of an adult p53+/−, nf1b−/−, nf1a+/, suz12a+/, suz12b+/ fish bearing two independent GFP-positive tumors in abdominal and anal locations. (B) Proportion of fish with multiple lesions in different suz12-mutant populations with additional p53+/−, nf1b−/−, nf1a+/ or p53+/−, nf1b−/−, nf1a+/+ backgrounds. Data are mean±s.d. of populations with any combination of three out of four (suz12+/−/−/−), two out of four (suz12+/+/−/−), or one out of four (suz12+/+/+/−) suz12 alleles knocked out. The total number of fish analyzed is indicated (n). P-values were calculated using Student's t-tests. (C) Representative HE-stained sections of p53/nf1/suz12-deficient fish with two separate tumor foci. Squares indicate areas shown in magnified images below.

Acknowledgments
This image is the copyrighted work of the attributed author or publisher, and ZFIN has permission only to display this image to its users. Additional permissions should be obtained from the applicable author or publisher of the image. Full text @ Dis. Model. Mech.