IMAGE

Figure 4

ID
ZDB-IMAGE-200905-21
Source
Figures for Sone et al., 2020
Image
Figure Caption

Figure 4

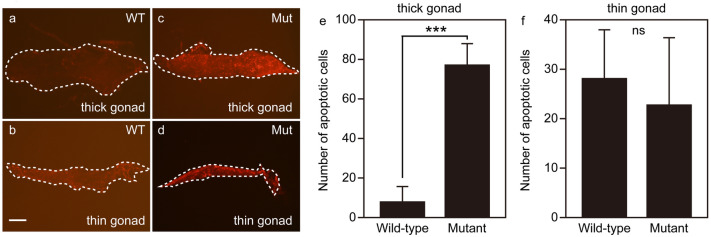
Dying cells in immature gonads of ddx5-deficient fish. (af) TUNEL analysis. (a, b) Wild-type. (c, d) ddx5−/− mutant. (a, c, e) Thick immature gonads. (b, d, f) Thin immature gonads. Scale bar 200 μm. (e) The number of apoptotic cells in wild-type (e; n = 12, total 94 positive cells) (f; n = 4, total 113 positive cells) and ddx5−/− mutants (e; n = 7, total 538 positive cells) (f; n = 7, total 160 positive cells) were counted. Error bars indicate standard deviation. Asterisks indicate statistical significance between wild-type and mutant samples (by t test). ***P < 0.001. ns not significant.

Figure Data
Acknowledgments
This image is the copyrighted work of the attributed author or publisher, and ZFIN has permission only to display this image to its users. Additional permissions should be obtained from the applicable author or publisher of the image. Full text @ Sci. Rep.