IMAGE

Fig 4

ID
ZDB-IMAGE-200829-105
Source
Figures for Wilson et al., 2020
Image
Figure Caption

Fig 4 The <italic>stl</italic> and <italic>c655 mttp</italic> mutations have differential effects on growth and the accumulation of lipid in intestine and liver.

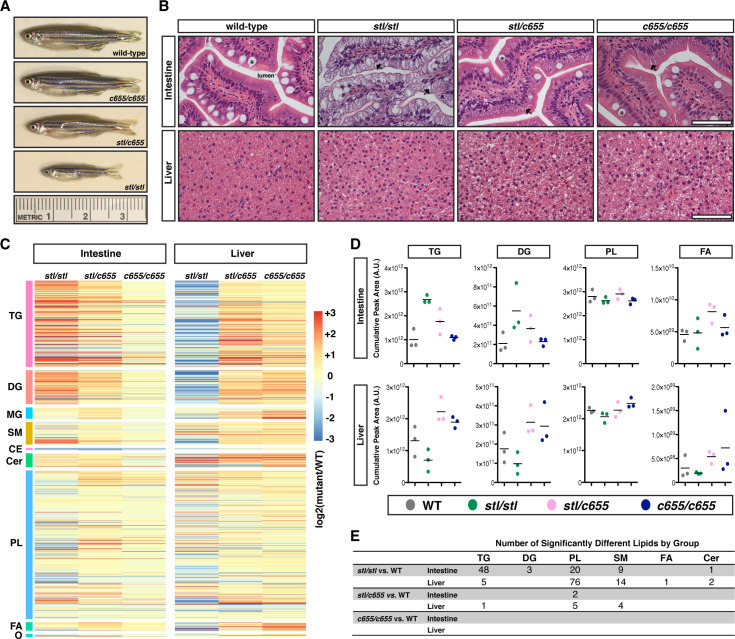
(A) Representative images of male WT and mttp mutant fish at 12 weeks of age. (B) Representative images of H&E stained intestine and liver from adult male WT and mttp mutant fish (7.5 mo), scale = 50 μm, * indicate goblet cells, arrows indicate representative lipid accumulation in enterocytes. (C–E) Intestine and liver tissue from adult male fish were extracted based on equal concentration of protein. Tissue lipid extracts from WT and mttp mutant fish were quantitated using an HPLC system coupled to a tandem mass spectrometer (LC-MS/MS) (n = 3; 1 fish per sample/genotype). (C) Heat maps represent fold-change from WT of over 1000 individual lipid species grouped into lipid classes (triacylglycerol [TG, n = 274], diacylglycerol [DG, n = 108], monoacylglycerol [MG, n = 36], sphingomyelin [SM, n = 72], cholesterol ester [CE, n = 7], ceramides [Cer, n = 44], phospholipid [PL, n = 472], free fatty acid [FA, n = 27] and other lipids [O; including sterols, sphingosine, sulfatide, zymosteryl and wax esters, n = 10]). (D) Quantification of total intestinal and liver TG, DG, PL, and FA from mutant lines as expressed as a sum of lipid group (n = 3). For additional lipid groups, see S11 Fig. (E) The number of individual lipid species data from panel (C) that are statistically different from WT (adj. p < 0.20).

Figure Data
Acknowledgments
This image is the copyrighted work of the attributed author or publisher, and ZFIN has permission only to display this image to its users. Additional permissions should be obtained from the applicable author or publisher of the image. Full text @ PLoS Genet.