
|
Figure 5
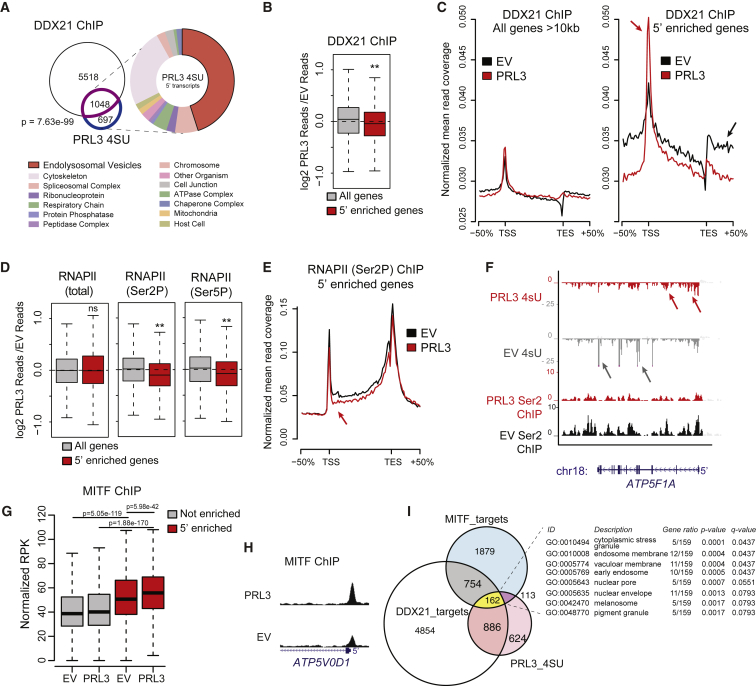
PRL3 Restrains Pol II Transcriptional Elongation of DDX21 Target Genes at MITF Targets
(A) Venn diagram of overlapping genes between DDX21 ChIP targets (purple) and PRL3 5′-enriched genes (blue) (p = 7.63 e-99, Fisher's exact test). GO enrichment analysis of cellular components (false discovery rate [FDR] < 0.05). See also
(B) DDX21 ChIP-seq data as log2 ratios of PRL3 over-expressing (PRL3) versus empty vector (EV) control for all long (All genes) and 5'-enriched genes., ∗∗p = 1.61 × 10⁻⁸, Wilcoxon signed-rank test.
(C) DDX21 ChIP-seq read profile for all long or 5′-enriched genes in control EV and PRL3-expressing cells. In 5′-enriched genes, PRL3 causes a net accumulation of DDX21 to the 5′ end (red arrows) versus EV control-treated cells (black arrow).
(D) Boxplots of RNAP II (total, Ser2P, and Ser5P) ChIP-seq data shown as ratios of PRL3 versus control read depth for all long genes and 5′-enriched genes. (5′-enriched p = 0.83, 1.26 × 10⁻¹⁸ 3.93 × 10⁻¹¹ for total, Ser2P, and Ser5P RNAP, respectively; Wilcoxon signed-rank test).
(E) RNAP II (Ser2P) ChIP-seq profile for 5′-enriched genes in EV control and PRL3-expressing cells. RNAP II (Ser2P) signal is decreased at the 5′ end (red arrow) and throughout the gene body versus control cells (black).
(F) 4sU RNA-seq and RNA PolII (Ser2P) ChIP-seq transcript coverage for
(G) MITF ChIP-seq signal surrounding the TSS (±1 kb) for non-5′-enriched (gray) and 5′-enriched (red) genes (p values determined using paired and un-paired Wilcoxon rank sum tests for within and between gene set comparisons, respectively).
(H) MITF ChIP-seq profile of
(I) Venn diagram of DDX21 ChIP targets (white, 6,566 total), PRL3 5′-accumulated genes (pink, 1,745 total), and MITF ChIP targets (blue, 2,908 total). 162 genes overlap the three groups, highlighted in yellow (p = 6.67e−06, hypergeometric test). Table lists cellular component GO enrichment analysis of these 162 genes (FDR < 0.05). See also
Reprinted from Developmental Cell, 54(3), Johansson, J.A., Marie, K.L., Lu, Y., Brombin, A., Santoriello, C., Zeng, Z., Zich, J., Gautier, P., von Kriegsheim, A., Brunsdon, H., Wheeler, A.P., Dreger, M., Houston, D.R., Dooley, C.M., Sims, A.H., Busch-Nentwich, E.M., Zon, L.I., Illingworth, R.S., Patton, E.E., PRL3-DDX21 Transcriptional Control of Endolysosomal Genes Restricts Melanocyte Stem Cell Differentiation, 317-332.e9, Copyright (2020) with permission from Elsevier. Full text @ Dev. Cell