Figure Caption
Figure 2
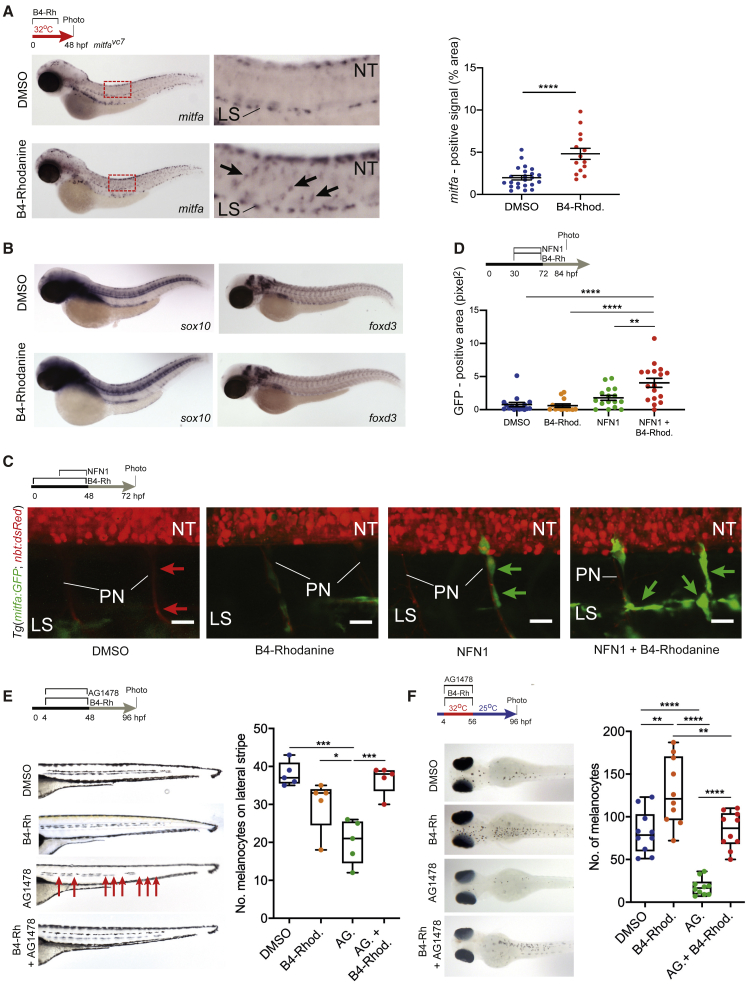
Inhibition of Prl3 Leads to Premature Melanoblast Expansion during Regeneration
(A) mitfa in situ hybridization of DMSO and B4-Rh-treated mitfavc7 zebrafish. Red box: zoomed region. Arrows: mitfa+ melanoblasts. LS, lateral stripe; NT, neural tube. Percentage area covered by mitfa-positive staining per embryo quantified (∗∗∗∗p < 0.0001, t = 4.670, df = 35, unpaired, two-tailed t test). Line and error bars, mean ± SEM (DMSO, n = 23; B4-Rh, n = 14 embryos).
(B) sox10 (DMSO, n = 21; B4-Rh, n = 16) and foxd3 (DMSO, n = 10; B4-Rh, n = 10) RNA in situ hybridization of treated mitfavc7 zebrafish.
(C) Confocal imaging of the MSC lineage during treatments specified. Tg(mitfa:GFP) marks regenerating melanoblasts (green arrows). Tg(nbt:dsRED) marks neural tube and axons (red arrows). n = 3 zebrafish per condition. NT, neural tube; PN, peripheral nerves; LS, lateral stripe. Maximum projection. Stack height: 30 μm. Scale bar: 20 μm.
(D) Quantification of area of GFP expression (pixels2) on individual peripheral nerves of 84 hpf Tg(mitfa:GFP, nbt:dsRED) zebrafish embryos, 12-h post-washout treatment specified. B4-Rhod, DMSO, NFN1, and combination, n = 3 embryos; B4-Rhod control, n = 2 embryos. Line and error bars, mean ± SEM ∗∗p = 0.0039, ∗∗∗∗p = < 0.0001, ANOVA using Tukey’s analysis.
(E) Lateral stripe melanocytes following specified treatments. AG.: AG1478. B4-Rhod: B4-Rhodanine. Red arrows: missing melanocytes; faint melanocytes from opposite side of the body are also visible. Quantification of melanocytes on the lateral stripe of embryos at 96 hpf, ∗p = 0.0364; ∗∗∗p = 0.0003 and 0.0006 for DMSO versus AG. and AG. versus AG. + B4-Rhod, respectively, ANOVA using Tukey’s analysis.
(F) Melanocyte regeneration in mitfavc7 mutant embryos following specified treatments. AG.: AG1478. B4-Rhod or B4-Rh: B4-Rhodanine. Quantification of dorsal stripe melanocytes per embryo 40-h post-washout and mitfa activation, ∗∗p = 0.0013, 0.0023 for DMSO versus B4-Rhod and B4-Rhod versus AG + B4-Rhod, respectively; ∗∗∗∗p < 0.0001, ANOVA using Tukey’s analysis.
Acknowledgments
This image is the copyrighted work of the attributed author or publisher, and
ZFIN has permission only to display this image to its users.
Additional permissions should be obtained from the applicable author or publisher of the image.
Reprinted from Developmental Cell, 54(3), Johansson, J.A., Marie, K.L., Lu, Y., Brombin, A., Santoriello, C., Zeng, Z., Zich, J., Gautier, P., von Kriegsheim, A., Brunsdon, H., Wheeler, A.P., Dreger, M., Houston, D.R., Dooley, C.M., Sims, A.H., Busch-Nentwich, E.M., Zon, L.I., Illingworth, R.S., Patton, E.E., PRL3-DDX21 Transcriptional Control of Endolysosomal Genes Restricts Melanocyte Stem Cell Differentiation, 317-332.e9, Copyright
(2020) with permission from Elsevier.
Full text @ Dev. Cell