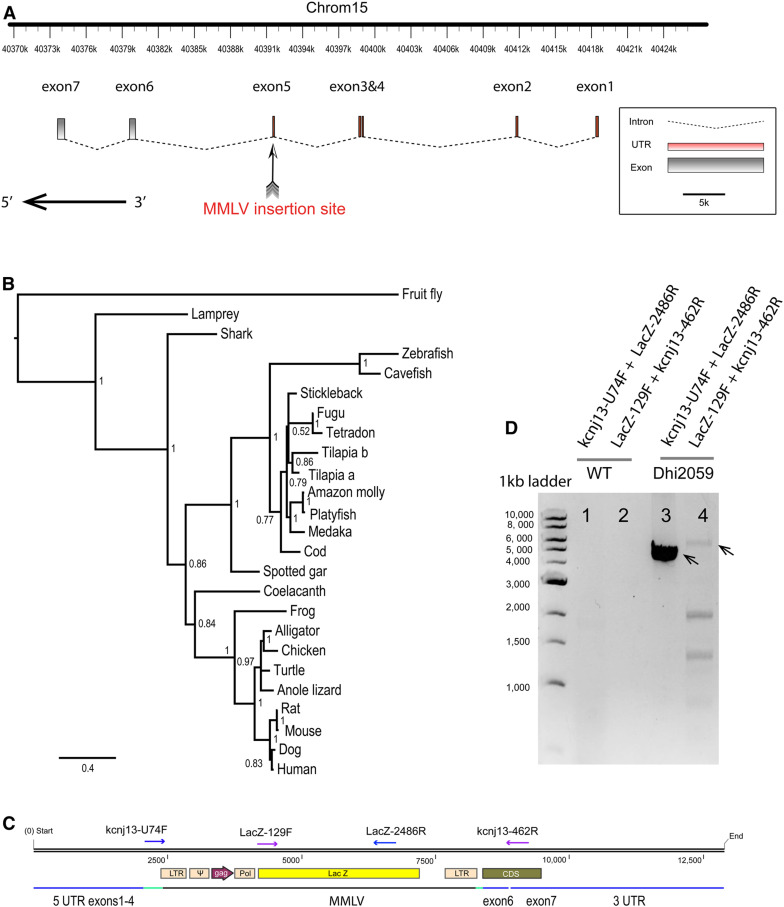
IMAGE

Figure 2

ID
ZDB-IMAGE-200821-9
Source
Figures for Silic et al., 2020
Image
Figure Caption

Figure 2

Viral insertion was identified in the kcnj13 gene locus and mRNA. (A) Schematic of the zebrafish kcnj13 gene denoting the position of viral insertions in the hi2059 mutant. The viral DNA randomly inserted into the fifth exon of the gene. The horizontal black arrow indicates the protein-coding area. (B) Extended majority-rule consensus phylogenetic tree for the Bayesian analysis of KCNJ13 proteins. Numbers at each node indicate pp values based on 20 million replicates. Branch lengths are proportional to means of the pp densities for their expected replacements per site. (C) The diagram of the viral insertion in the kcnj13 mRNA. The approximate positions of PCR primers are indicated with purple/blue arrows. Green lines indicate broken exon 5, and blue lines indicate the remaining exons. (D) Confirmation of chimera viral sequence and kcnj13 mRNA by RT-PCR. The expected sizes of PCR products are 5708 bp (Lacz-129F + kcnj13-462R) and 4509 bp (kcnj13-U74F + LacZ-2486R), respectively. The smaller bands in lane 4 are nonspecific amplified bands. kcnj13-U74F and kcnj13-462R are targeted at the beginning of exons 5 and 7, respectively. CDS, coding DNA sequence; LTR, long terminal repeat; mRNA, messenger RNA; pp, posterior probability; UTR, untranslated region.

Acknowledgments
This image is the copyrighted work of the attributed author or publisher, and ZFIN has permission only to display this image to its users. Additional permissions should be obtained from the applicable author or publisher of the image. Full text @ Genetics