IMAGE

Figure 3

ID
ZDB-IMAGE-200814-20
Source
Figures for Carrington et al., 2020
Image
Figure Caption

Figure 3

Somatic base editing with BE4max and AncBE4max. (
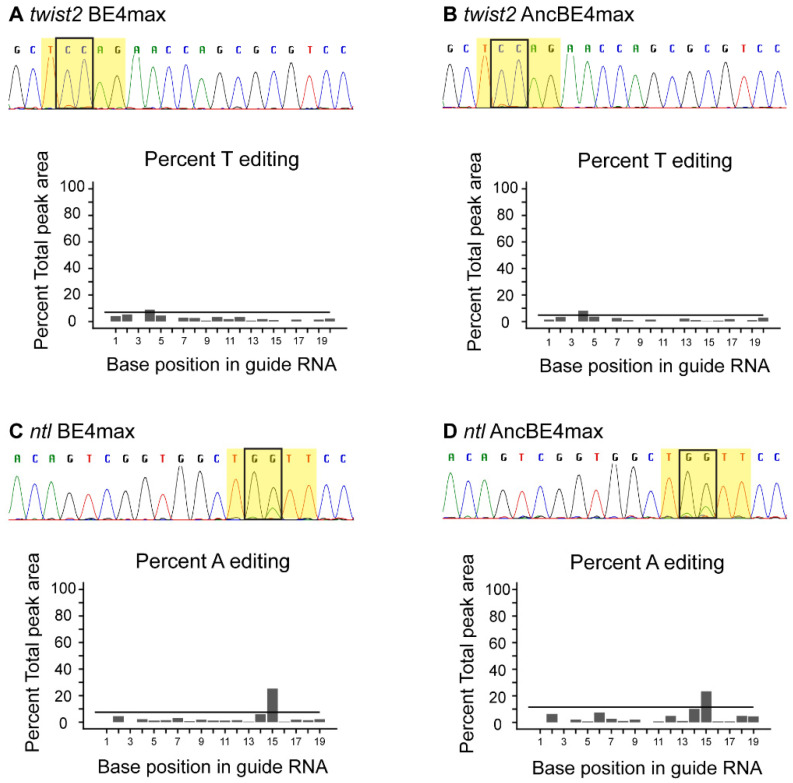
A,B) somatic base editing at twist2 locus with BE4max (A) and AncBE4max (B). (C,D) somatic base editing at ntl locus with BE4max (C) and AncBE4max (D). In all panels, partial sequence chromatograms of representative embryos are shown with the target window highlighted in yellow and target nucleotides boxed. EditR Quad plots for the expected edited allele are shown below each chromatogram. These plots show the percent editing (Y-axis) at each nucleotide by base position (X-axis), with a horizontal line representing the p-value cutoff of 0.01. Any nucleotide above this cutoff is considered a real secondary peak. Expected base pair changes are C → T for twist2 or G → A for ntl (ntl sgRNA is on the reverse strand and orientation shown here is to depict the open reading frame).

Acknowledgments
This image is the copyrighted work of the attributed author or publisher, and ZFIN has permission only to display this image to its users. Additional permissions should be obtained from the applicable author or publisher of the image. Full text @ Cells