
|
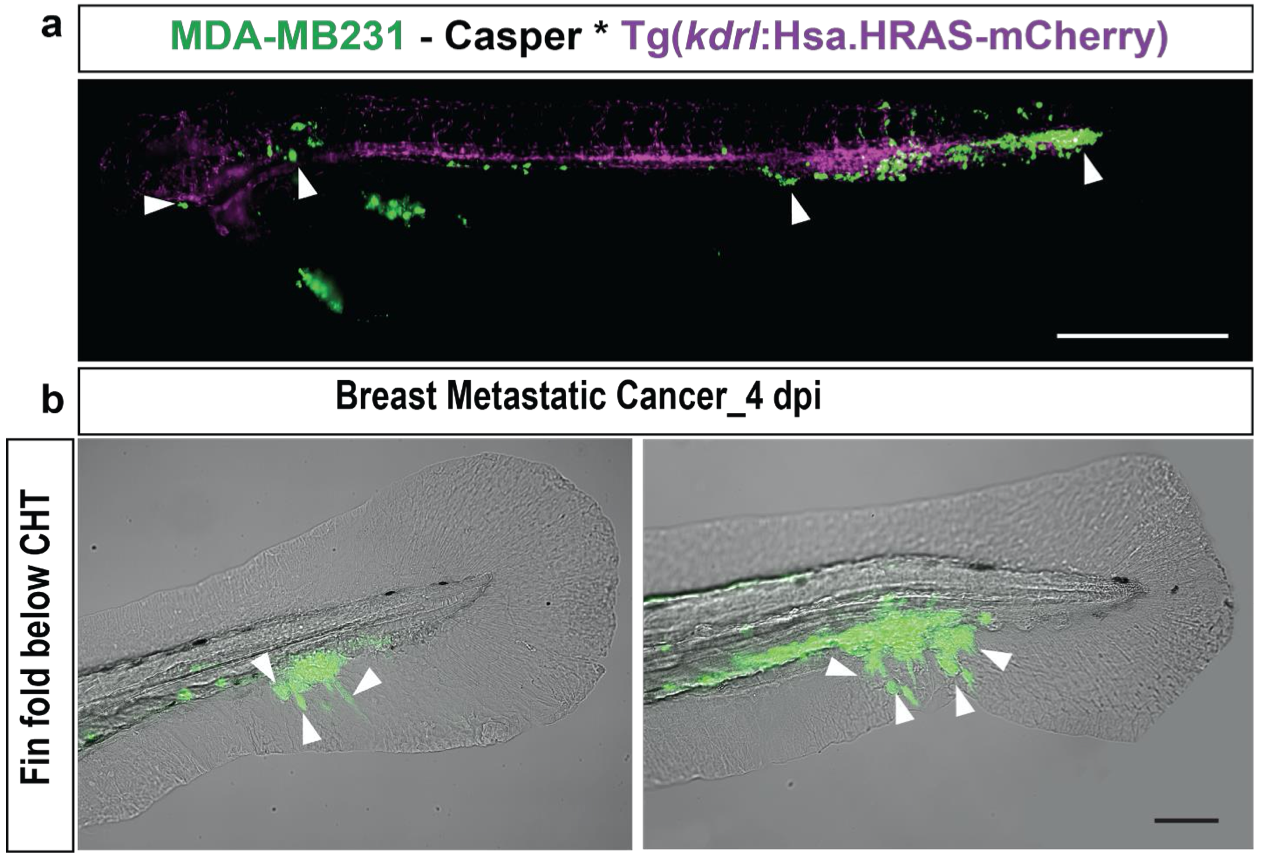
Fig. S4
Dissemination and tail invasion of metastatic breast tumor cells with stable GFP expression. (a) Representative image of eZXM expressing the vascular marker Tg(kdrl:Hsa.HRAS-mCherry) in the casper background injected with eGFP labeled breast tumor cells (MDA-MB231_eGFP). The cells disseminated throughout the embryo as indicated by the white arrowhead. Vasculature in magenta, breast tumor cells in green; scale bar: 500 μm. (b) Representative images of breast tumor cells initiating extravasation by forming protrusions (left, white arrowheads). Breast metastatic cells invaded the avascular tail region. Representative images of invading tumor cells (white arrowheads) in the fin-fold below the CHT region. Scale bars:100 μm.