
Image
|
Figure Caption
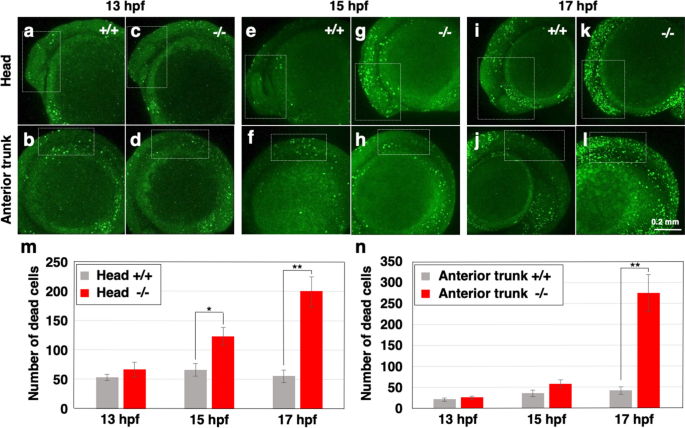
Fig. 3
Increase of cell death in polr2d mutants. (a–l) Images of acridine orange-labeled dead cells in zebrafish embryos. White dotted boxes mark the head (anterior to midbrain/hindbrain boundary; a, b, e, f, i, j) and anterior trunk (somite 1–4; c, d, g, h, k, l) regions. (m, n) The number of dead cells in the head (m) and anterior trunk (n) regions. Note that cell death in mutants increased at the onset of 15 hpf in the head and at the onset of 17 hpf in the anterior trunk. n = 7 for each sample set.
Figure Data
Acknowledgments
This image is the copyrighted work of the attributed author or publisher, and
ZFIN has permission only to display this image to its users.
Additional permissions should be obtained from the applicable author or publisher of the image.
Full text @ Sci. Rep.