
|
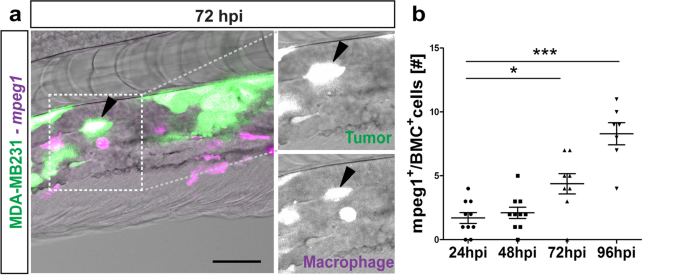
Fig. 4
Macrophages react to tumor cells. (a) Representative image of GFP-labeled breast metastatic cells (BMC) (MDA-MB231) (in green) xenografted in eZXM expressing mCherry-labeled macrophages (in magenta). Co-localization of tumor cells with macrophages was observed (black arrowhead). Higher magnification of boxed region with MDA-MB231 cell (green—top) and macrophage (magenta—bottom). Scale bar 100 µm. (b) Quantification of the co-localization of tumor cells (BMC+) with macrophages (mpeg1+) over time. At 72 hpi, a significant increase in co-localization was observed. Plot represented means ± sem [N = 10 embryos were quantified for each time points: 24, 48 hpi and 96 hpi]. Statistical analyses: one-way ANOVA followed by Dunnett’s test for multiple comparisons. Multiple comparisons: 24 hpi vs. 48 hpi (P = 0.9225); 24 hpi vs. 72 hpi (P = 0.0103); 24 hpi vs. 96 hpi (P < 0.0001).