IMAGE

Figure 6

ID
ZDB-IMAGE-200805-6
Source
Figures for Godoy et al., 2020
Image
Figure Caption

Figure 6

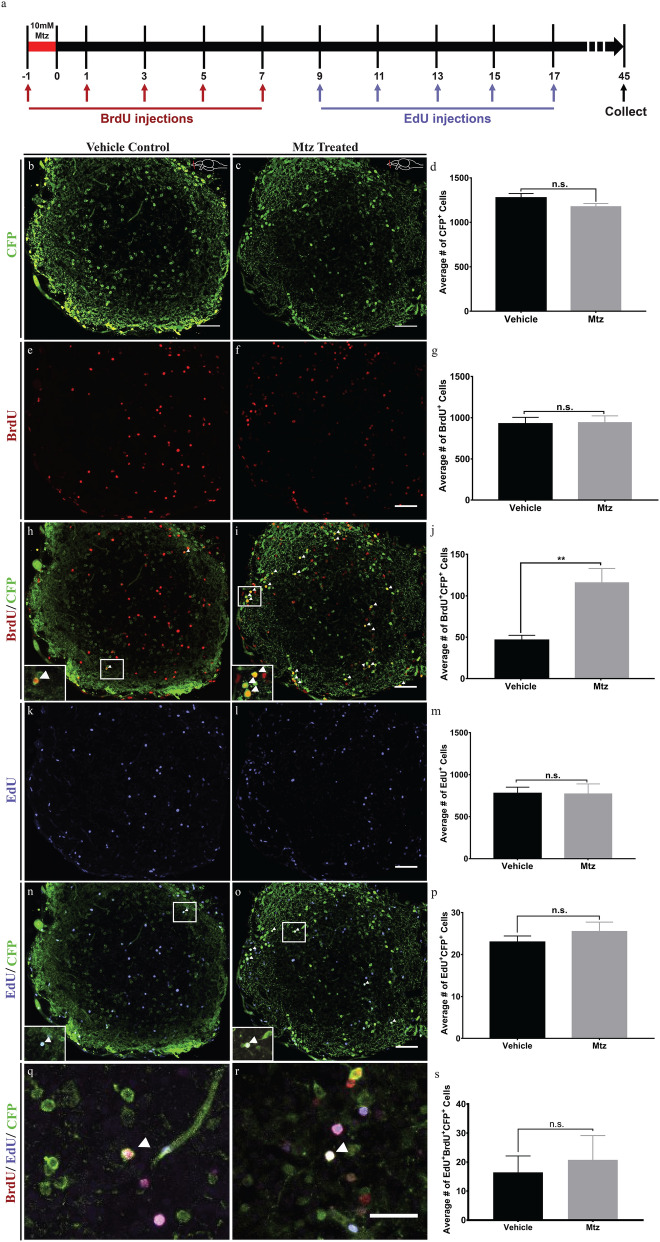
Formation of new CFP positive cells following neuronal ablation only occur before 9 days post ablation. (a) Timeline of experiment. (b, c) Representative images of a coronal OB section from Vehicle control (b) and Mtz treated (c) fish with cells expressing CFP. (d) Quantification of the number of CFP positive cells showing no significant difference between Mtz treated and control fish (n = 6). (e, f) Representative images of a coronal OB section from Vehicle control (e) and Mtz treated (f) fish with cells positive for BrdU. (g) Quantification of the number of BrdU positive cells relative to control. There was no significant difference between Mtz treated fish relative to control (n = 6). (h, i) Representative images of a coronal OB section from Vehicle control (h) and Mtz treated (i) fish with cells expressing. (j) Quantification of the number of cells positive for both BrdU and CFP relative to control. There was a 2.5-fold increase in the number of double labelled cells in Mtz-treated fish relative to control (n = 6). (k, l) Representative images of a coronal OB section from Vehicle control (k) and Mtz treated (l) fish with cells positive for EdU. (m) Quantification of the number of EdU positive cells relative to control. There was no significant difference between Mtz treated and control fish (n = 6). (n, o) Representative images of a coronal OB section from Vehicle control (n) and Mtz treated (o) fish with cells positive for both EdU and CFP. (p) Quantification of the number of EdU and CFP positive cells relative to control. There was no significant difference between Mtz treated and control fish (n = 6). (q, r) Representative images of a coronal OB section from Vehicle control (q) and Mtz treated (r) fish positive for BrdU, EdU, and CFP. (s) Quantification of the number of triple-labelled cells relative to control. There was no significant difference between Mtz treated fish relative to control. **P < 0.01, n.s. = not significant, N = 6. Scale bar: 50 μm.

Acknowledgments
This image is the copyrighted work of the attributed author or publisher, and ZFIN has permission only to display this image to its users. Additional permissions should be obtained from the applicable author or publisher of the image. Full text @ Sci. Rep.