IMAGE

Figure 4

ID
ZDB-IMAGE-200805-4
Source
Figures for Godoy et al., 2020
Image
Figure Caption

Figure 4

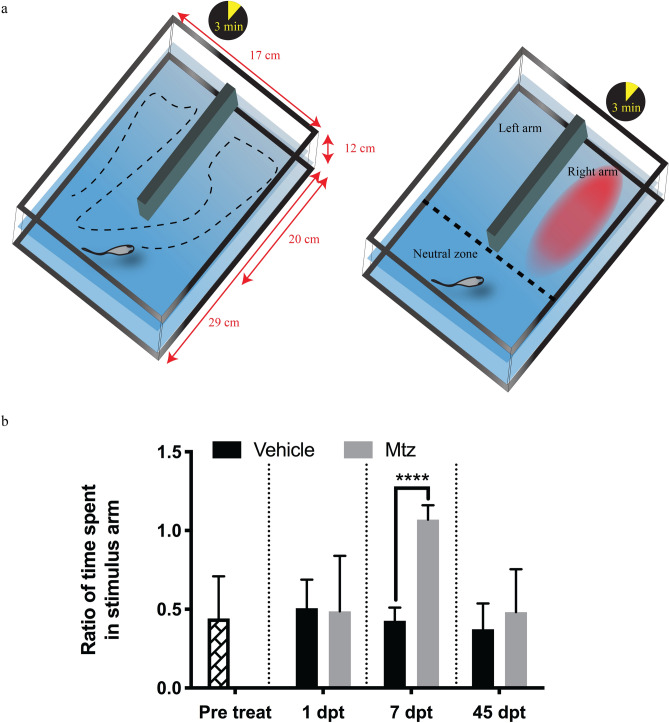
Decreased olfactory function following neuronal ablation. (a) Schematic representation of the tank designed to address OB phenotype. The tank contained a mid-tank wall separating space into 3 areas: left arm, right arm and neutral zone. Animals were allowed to swim freely for 3 min prior to the addition of repulsive stimulus cadaverine. Animal response to the stimulus was recorded for 3 additional minutes. (b) Animals tend to spend equal time swimming across different zones of tank prior to stimuli. Upon stimulus, control fish decrease total time spent in the stimulus arm, whereas this ability is impaired upon Mtz treatment at 7 days post ablation but recovered by day 45. ****(p ≤  0.0001). (Sample size of n = 6 animals for each treatment and time poit except for 1 dpt where n = 3, statistical power was calculated using a multiple t test corrected for multiple comparison using Holm–Sidak post hoc).

Acknowledgments
This image is the copyrighted work of the attributed author or publisher, and ZFIN has permission only to display this image to its users. Additional permissions should be obtained from the applicable author or publisher of the image. Full text @ Sci. Rep.