IMAGE

Figure 1

ID
ZDB-IMAGE-200805-2
Source
Figures for Godoy et al., 2020
Image
Figure Caption

Figure 1

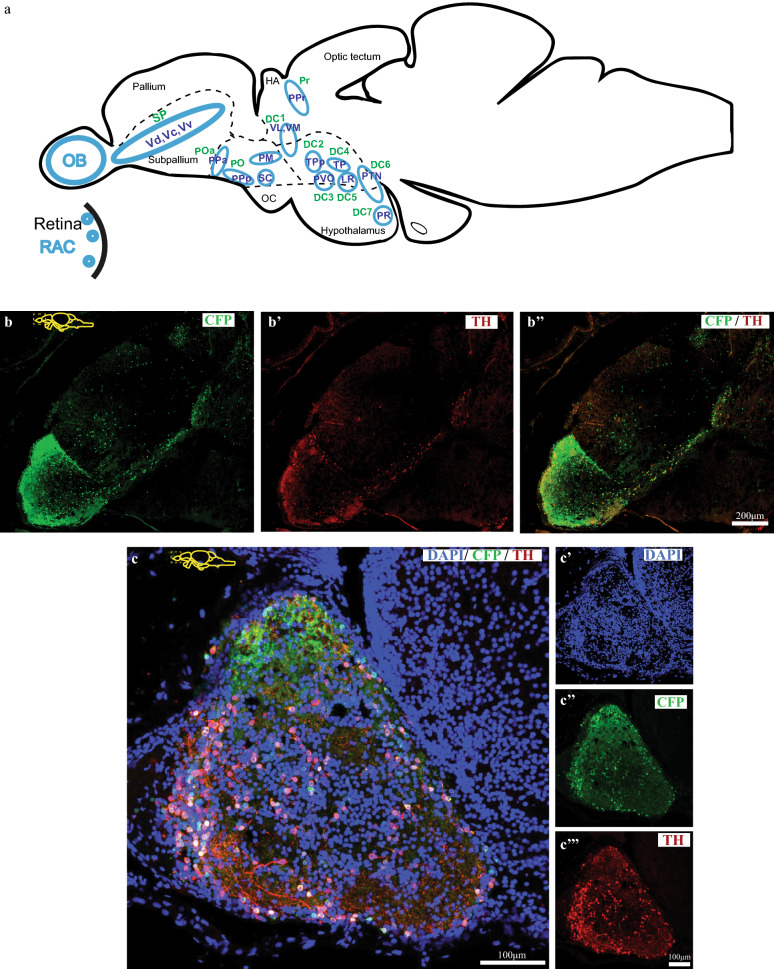
Expression of Tg(dat:CFP-NTR) in the adult zebrafish brain. (a) Schematic representation of DA clusters expressing CFP-NTR. These include the amacrine cells of the retina (RAC), cells of the olfactory bulb (OB), of the ventral telencephalon (Vd, Vc and Vv), of the preoptic area (POa, PO), periventricular pretectal nucleus (PPr) and DA-producing cells of the diencephalon (DC). (b) Sagittal section of the telencephalon showing CFP-expressing cells (green) and co-expression with TH (red). (c) Sagittal section of adult zebrafish olfactory bulb showing cell nuclei (DAPI) (c′), CFP (c″) and TH (c‴). (d) Transverse section of a medial olfactory bulb section showing expression of DAPI (d), CFP (green) (d′) or TH (red) (d″) and its colocalization (d‴); followed by its magnified image (ee‴).

Acknowledgments
This image is the copyrighted work of the attributed author or publisher, and ZFIN has permission only to display this image to its users. Additional permissions should be obtained from the applicable author or publisher of the image. Full text @ Sci. Rep.