
|
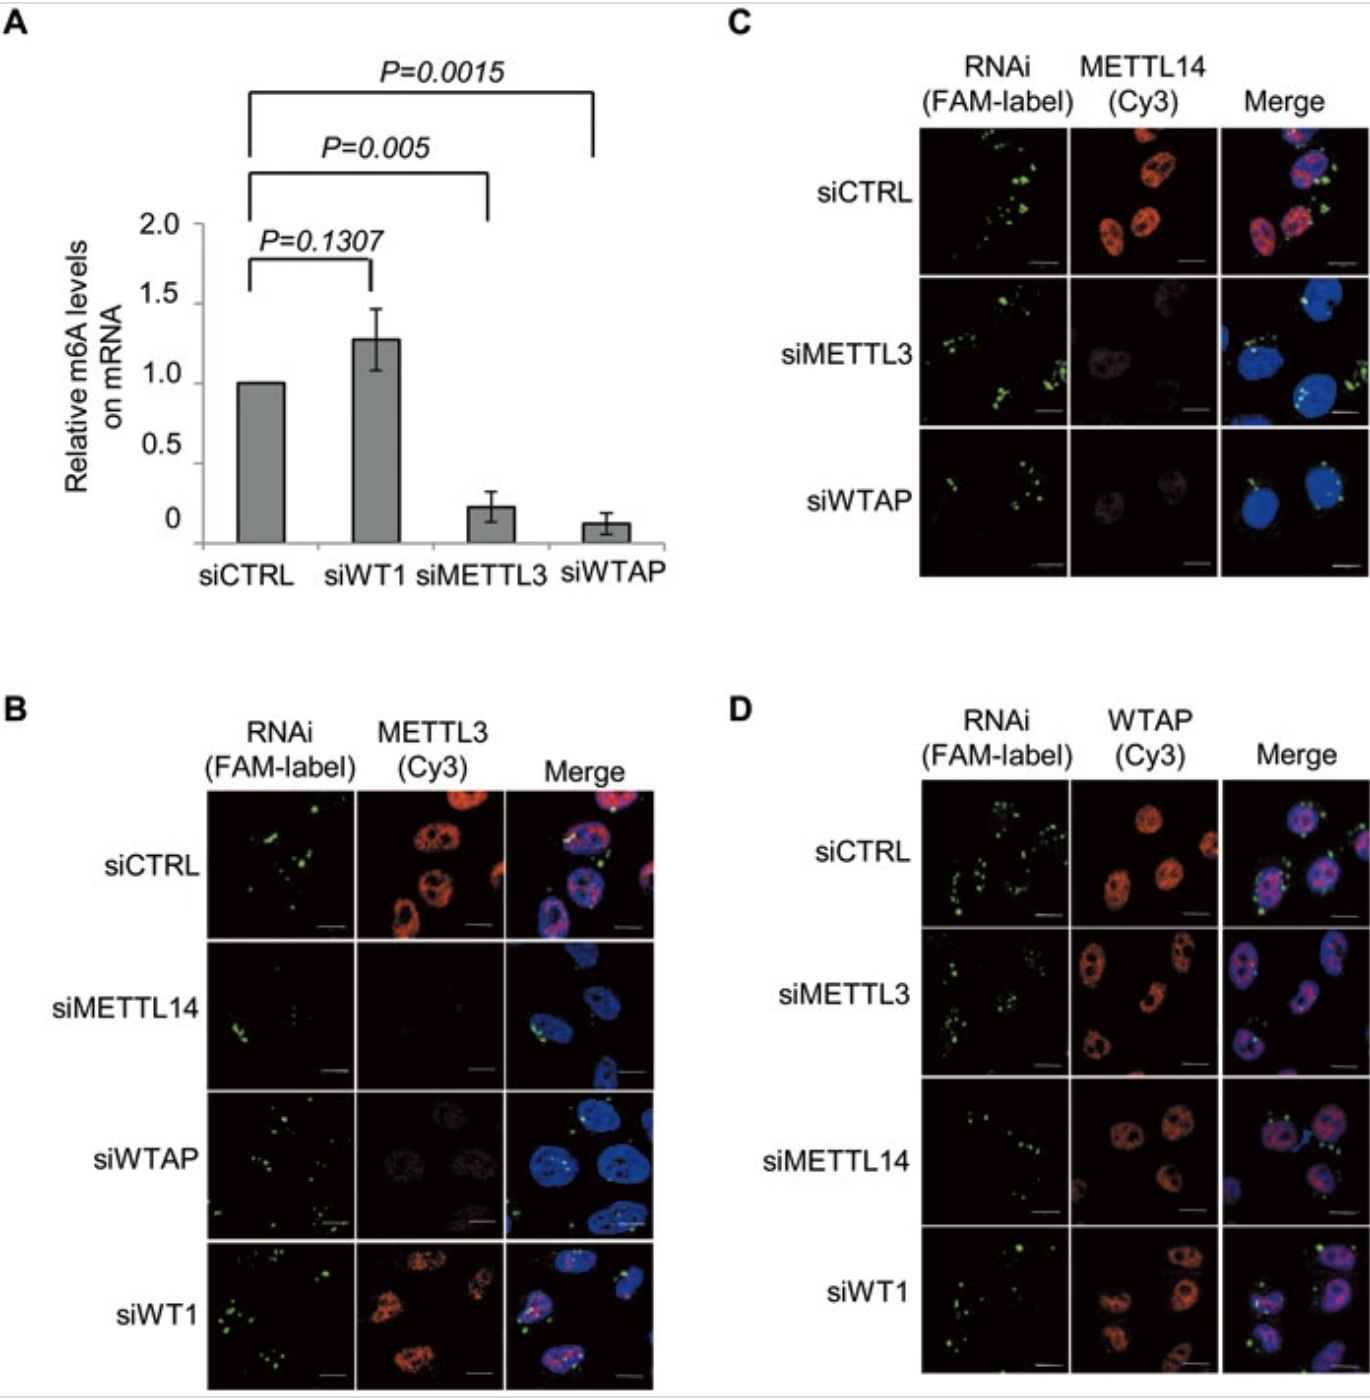
Fig. 2
WTAP regulates the nuclear speckle localization of METTL3 and METTL14. (A) The graph represents the quantification of three independent dot-blot experiments (raw data were included in Supplementary information, Figure S3A). The y-axis represents the relative intensity of dots relative to that of the control group. P values were calculated using a two-tailed t-test. Error bars represent SD. (B-D) After transfection (48 h) with the indicated fluorescence FAM-labeled siRNA, HeLa cells were fixed and immunostained with the indicated antibodies. DNA was visualized by DAPI. Scale bar, 10 μm. Supportive data were included in Supplementary information, Figure S3.