
|
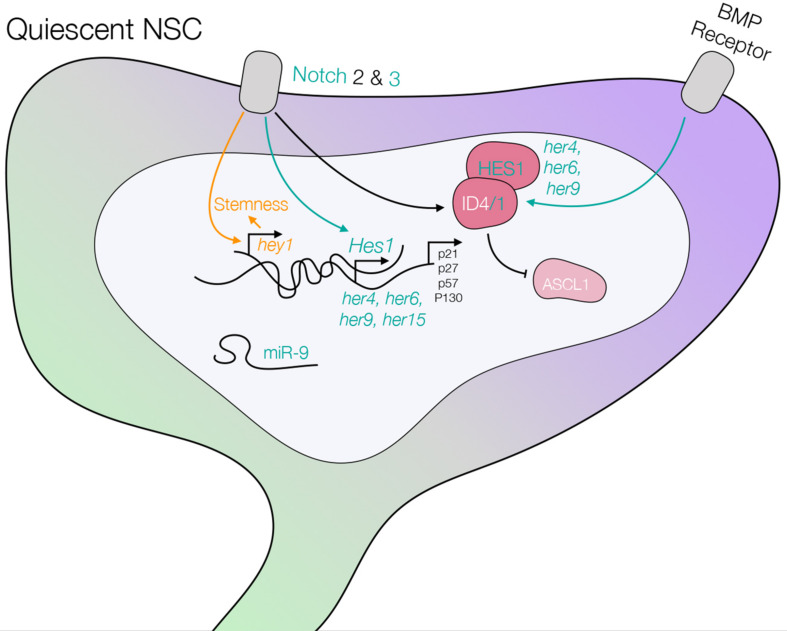
FIGURE 6
Schematic of a quiescent NSC including the pathways controlling quiescence, which are summarized in this review. The scheme highlights knowledge generated in mouse, and confirmed pathways in zebrafish are illustrated in green. Knowledge generated in zebrafish and later extended to mouse is shown in green as well. Knowledge generated in zebrafish and still to be confirmed in mouse is depicted in yellow. Differences (Notch2 is not expressed in qNSCs in zebrafish), or data that need consolidation in zebrafish (Ascl1 expression and its regulation by ID and Hes1, BMP receptor), are shown in black. See text and