IMAGE

FIGURE 4

ID
ZDB-IMAGE-200725-13
Source
Figures for Labusch et al., 2020
Image
Figure Caption

FIGURE 4

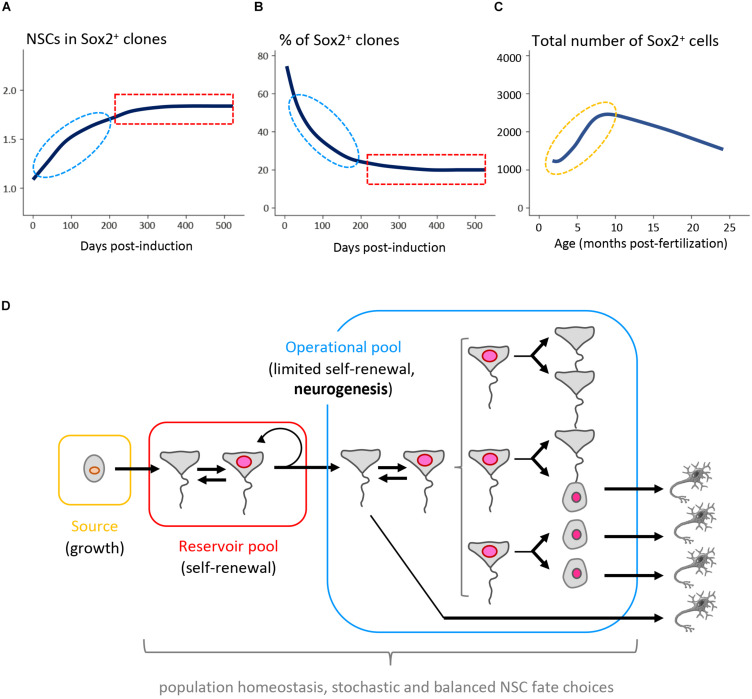
Long-term NSC and neurogenesis dynamic in the adult zebrafish pallium. (A,B) Genetic clonal analysis driven by the her4:ERT2CreERT2 transgene with chase time over 500 days. The number of NSCs per clone containing at least one Sox2+ cell (A) and the proportion of clones containing at least one Sox2+ cell (B) display a bi-phasic dynamics at long term. At early time points after induction, neutral drift is observed -red-. At later time points, a behavior characteristic of single cell-based self-renewal appears -blue-. These two dynamics reflect the behavior of two embedded populations (operational and reservoir, respectively). (C) Total number of Sox2+ cells in the adult Dm between 3 and 25 months post-fertilization (mpf). The Sox2+ population increases in size in the young adult (3–8 mpf), reflecting the NSC-generating activity of a “source” population (orange). (D) Schematic of the proliferative hierarchy of NSC sub-populations sustaining overall NSC maintenance in Dm. Color code as in (A–C) (Than-Trong et al., 2020).

Acknowledgments
This image is the copyrighted work of the attributed author or publisher, and ZFIN has permission only to display this image to its users. Additional permissions should be obtained from the applicable author or publisher of the image. Full text @ Front Cell Dev Biol