IMAGE

FIGURE 3

ID
ZDB-IMAGE-200725-12
Source
Figures for Labusch et al., 2020
Image
Figure Caption

FIGURE 3

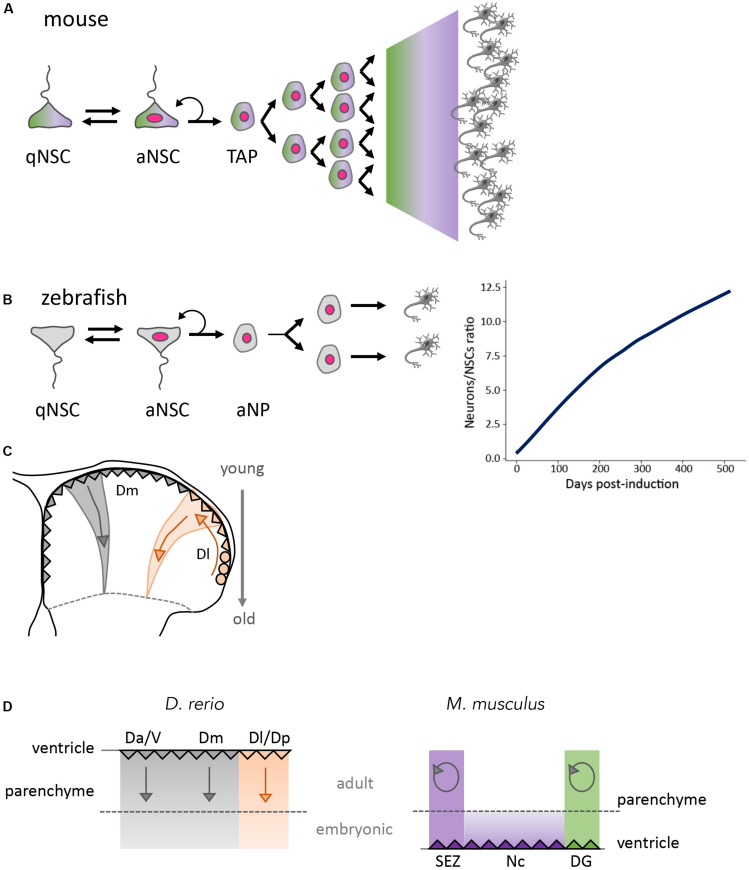
Global outputs of adult neurogenesis in zebrafish and mouse. (A) Scheme of a typical neurogenesis lineage in adult mouse. Upon quiescence exit, NSCs generate neurons via TAPs. TAPs have variable amplification capacity, high in the SEZ, lower in the DG. Green and purple shades are meant to represent shared cells and attributes between the SEZ and DG (color code in Figure 2C, with proliferating cells indicated with a pink nucleus). (B) Scheme of a typical neurogenic lineage in the adult zebrafish pallium (left) and neuronal output (right). Neurons are generated via an intermediate progenitor (NP: neural progenitor) of limited amplification potential. Because adult-generated neurons persist, however, the number of neurons generated per NSC increases over time in genetically traced lineages from individual NSCs. (C) Spatio-temporal distribution of the neurogenesis output in the zebrafish pallium, from embryonic stages until adult life. Radial glia (triangles) generate neurons that stack in age-related order within the telencephalic parenchyma. Old neurons, at the pallial-subpallial boundary, were generated in the embryo and early larva. In the lateral pallium (orange), the same process operates but radial glia are generated during juvenile and adult stages from NE progenitors (circles). Arrows indicate the spatial organization of neurogenesis over time. (D) Compared output of neurogenesis in the pallium of zebrafish and mouse from embryo to adult, represented on schematic cross-sections where the dotted line separates neurons generated at embryonic versus post-embryonic stages. Neurogenesis is continuous and additive (straight arrows) in zebrafish in all pallial subdivisions (left panel). Neurogenesis stops at birth in the mouse neocortex, spatially isolating the two persisting neurogenic niches SEZ and SGZ. Neurogenesis in these niches is mostly used for neuron replacement (circular arrows) (right panel). Color code as in Figure 1 (Seri et al., 2004; Encinas et al., 2011; Rothenaigner et al., 2011; Lugert et al., 2012; Ponti et al., 2013; Furlan et al., 2017; Than-Trong et al., 2020). D, dorsal part of the telencephalon (pallium); Da, anterior part of D; Dm, medial part of D; Dl, lateral part of D; aNSC, activated neural stem cell; qNSC, quiescent neural stem cell; NP, neural progenitor; TAP, transit amplifying progenitor; V, ventral telencephalon (sub-pallium).

Acknowledgments
This image is the copyrighted work of the attributed author or publisher, and ZFIN has permission only to display this image to its users. Additional permissions should be obtained from the applicable author or publisher of the image. Full text @ Front Cell Dev Biol