IMAGE

Figure 2

ID
ZDB-IMAGE-200720-11
Source
Figures for Amorim et al., 2020
Image
Figure Caption

Figure 2

nog2 Genomic Regulatory Landscape Contains a Notochord-Specific Enhancer

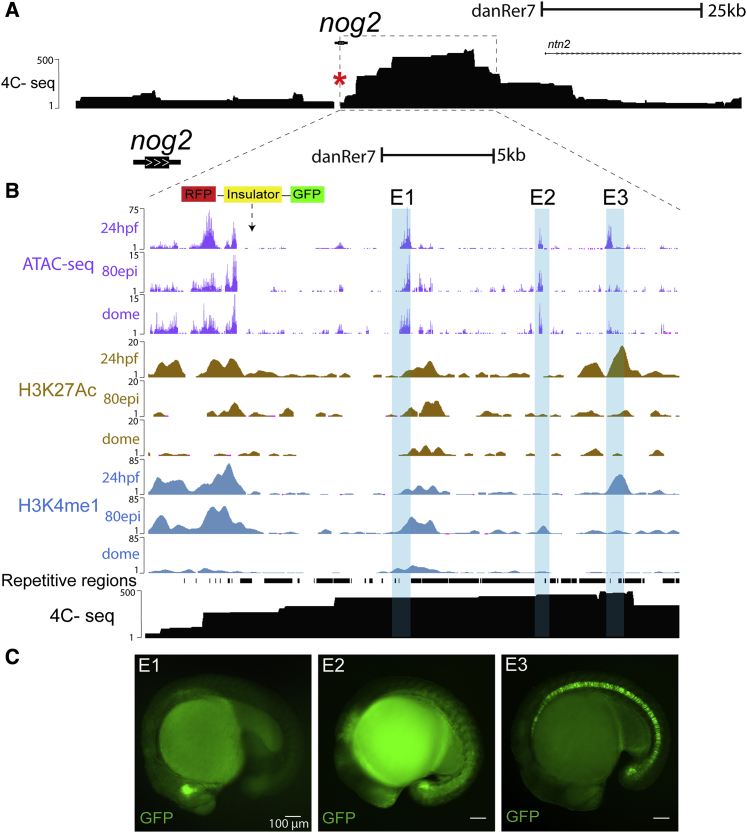
(A) Genomic landscape of nog2, represented in the University of California Santa Cruz Genomics Institute (UCSC) genome browser (Kent et al., 2002), comprising more than 100 kb. The black track represents chromatin interaction points detected by 4C-seq using the nog2 promoter as the viewpoint (red asterisk). Scale bar represents 25 kilobases.

(B) Zoom-in in the locus of nog2 comprising approximately 25 kb. Representation of the ED transposon integration 2 kb downstream of nog2. Purple (top), brown (middle), and blue (bottom) tracks represent the ATAC-seq and chromatin immunoprecipitation sequencing (ChIP-seq) signal for H3K27ac and H3K4me1, respectively, at three developmental times: 24 hpf, 80% epiboly (80 epi), and dome. The black track represents the 4C-seq signal at 24 hpf using the nog2 promoter as the viewpoint. Pale blue boxes highlight selected sequences for enhancer activity assays (E1 to E3). Two replicates of 4C data are shown in Figure S3. Scale bar represents 5 kilobases.

(C) Representative images of GFP reporter lines for enhancers E1 to E3 (see also Figure S1). Scale bars represent 100 μm.

Acknowledgments
This image is the copyrighted work of the attributed author or publisher, and ZFIN has permission only to display this image to its users. Additional permissions should be obtained from the applicable author or publisher of the image. Full text @ Cell Rep.