IMAGE

Figure 7

ID
ZDB-IMAGE-200718-26
Source
Figures for Bise et al., 2020
Image
Figure Caption

Figure 7

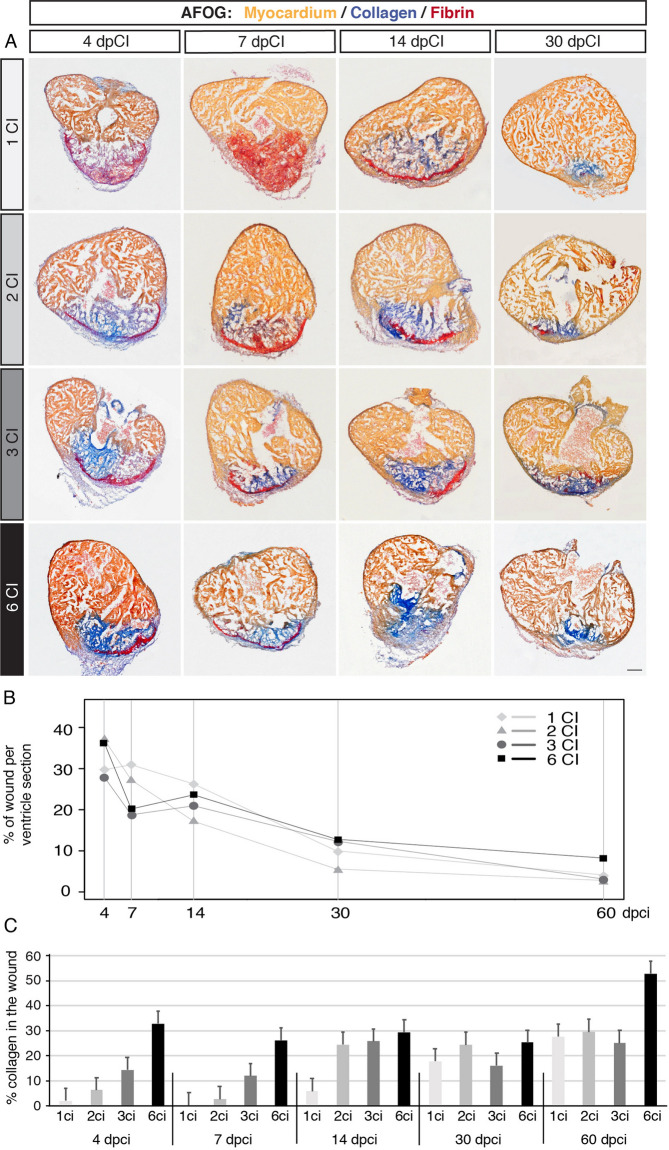
Comparison of regenerative dynamics between hearts after multiple cryoinjuries. (A) Representative sections of regenerating hearts stained with the AFOG reagent, showing the myocardium (beige), fibrin (red) and collagen (blue) at different time points following cryoinjuries. At 4 and 7 dpci, the wound contains markedly more collagen after multiple cryoinjuries as compared to that after one cryoinjury. Scale bar = 100 µm. (B) Linear representation of the percentage of wounded area per ventricle sections at different regenerative time-points. All experimental groups exhibit similar dynamics of regeneration, but hearts after six cryoinjuries comprise the largest wound as compared to other groups, at 60 dpci. N ≥ 4 hearts, 3 sections per heart. (C) Histogram showing the percentage of collagen staining within the remaining wounded area. After multiple cryoinjuries, the amount of collagen is high already at the early time points of regeneration. N ≥ 4 hearts, 3 sections per heart.

Acknowledgments
This image is the copyrighted work of the attributed author or publisher, and ZFIN has permission only to display this image to its users. Additional permissions should be obtained from the applicable author or publisher of the image. Full text @ Sci. Rep.