
Image
|
Figure Caption
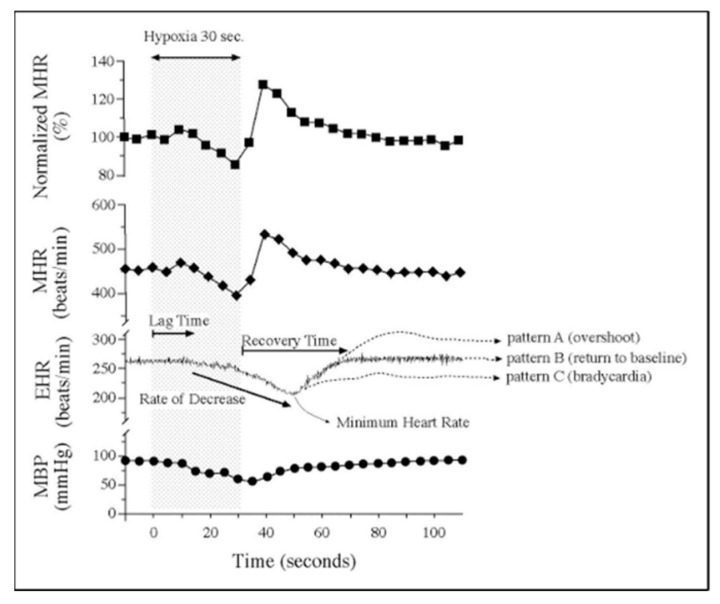
Figure 15
Embryonic vulnerability to acute maternal hypoxia. Representative maternal heart rate (MHR), embryonic heart rate (EHR), and maternal blood pressure (MBP) before, during, and after 30 s of maternal hypoxia via suspended ventilation. Lag time is defined as time from the onset of maternal hypoxia to the onset of bradycardia. Recovery time is defined as time from minimum EHR to return to baseline EHR. Patterns of EHR recovery are defined as (
Acknowledgments
This image is the copyrighted work of the attributed author or publisher, and
ZFIN has permission only to display this image to its users.
Additional permissions should be obtained from the applicable author or publisher of the image.
Full text @ J Cardiovasc Dev Dis