
Image
|
Figure Caption
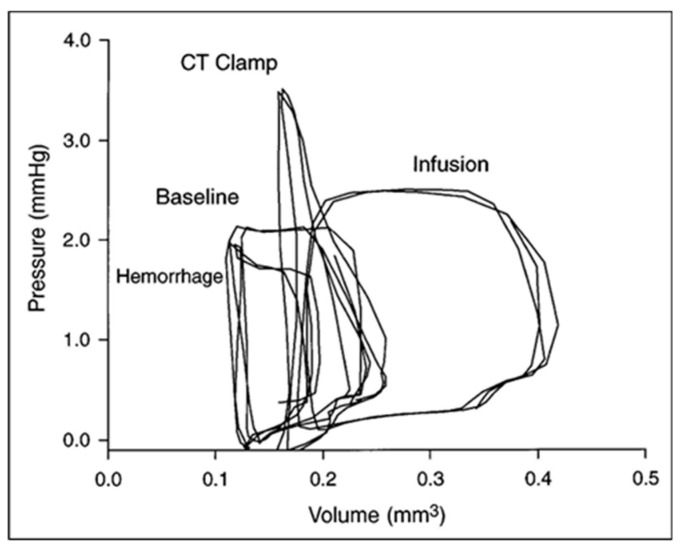
Figure 13
Ventricular–vascular uncoupling during acute conotruncal (CT) occlusion. Representative pressure–volume loops at baseline, during buffer infusion, and after CT clamp in a stage 21 chick embryo. Note the increased end-systolic pressure despite reduced stroke volume during CT clamp consistent with contractile reserve and only a modest increase in end-systolic pressure during infusion consistent with a curvilinear end-systolic PV relation. This was adapted with permission [
Acknowledgments
This image is the copyrighted work of the attributed author or publisher, and
ZFIN has permission only to display this image to its users.
Additional permissions should be obtained from the applicable author or publisher of the image.
Full text @ J Cardiovasc Dev Dis