IMAGE

Figure 8

ID
ZDB-IMAGE-200716-61
Source
Figures for Keller et al., 2020
Image
Figure Caption

Figure 8

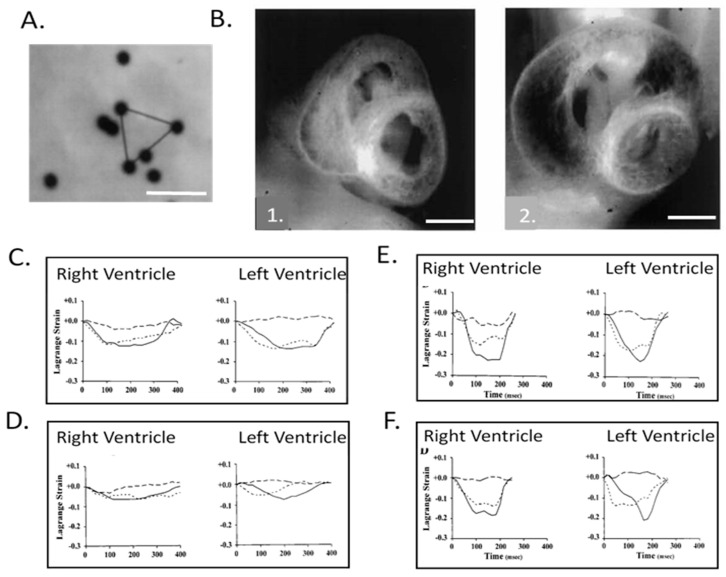
Right and left ventricular epicardial strains in normal and left heart hypoplasia chick embryos. (A) Representative video image of 10 μm diameter microspheres attached to the left ventricular (LV) epicardium of a stage 24 chick embryo. Epicardial strains were measured by tracking the motion of microspheres in triangular arrays. Scale bar = 50 μm. (B) Representative midventricular transverse sections for stage 27 normal (1.) and left-atrial ligated (LAL) (2.) chick embryos. Note the obvious increase in right ventricular (RV) and decrease in LV dimensions. Scale bar = 1 mm. (C) Representative developmental changes in strain–time curves for normal stage 21 chick ventricles; (D) stage 21 LAL chick ventricles; (E) stage 31 normal chick ventricles, and; (F) stage 31 LAL chick ventricles. Solid, broken, and dashed lines indicate epicardial circumferential, longitudinal, and shear strains, respectively. The x-axis is time (msec) and the y-axis is strain normalized to end-diastole. Note that from stage 21 to 31, the strain patterns change from isotropic to RV- and LV-specific anisotropic patterns and that LAL strains at stage 31 markedly differ from normal embryos. This was adapted with permission [134].

Acknowledgments
This image is the copyrighted work of the attributed author or publisher, and ZFIN has permission only to display this image to its users. Additional permissions should be obtained from the applicable author or publisher of the image. Full text @ J Cardiovasc Dev Dis