
Image
|
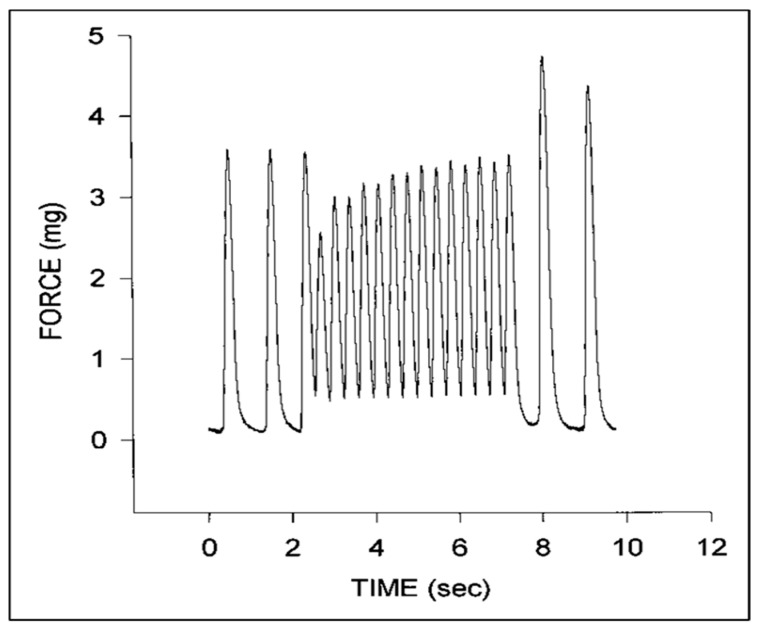
Figure Caption
Figure 7
Representative force tracings for a stage 24 chick embryo myocardial specimen. Note the initial increase in diastolic force and decrease in systolic force at higher pacing rates that gradually increases with time and the increase in peak systolic force upon return to the intrinsic pacing rate. This was adapted with permission [
Acknowledgments
This image is the copyrighted work of the attributed author or publisher, and
ZFIN has permission only to display this image to its users.
Additional permissions should be obtained from the applicable author or publisher of the image.
Full text @ J Cardiovasc Dev Dis