
IMAGE
Figure 5
- ID
- ZDB-IMAGE-200716-6
- Publication
- Gans et al., 2020 - Klf9 is a key feedforward regulator of the transcriptomic response to glucocorticoid receptor activity
- All Figures
- Figures for Gans et al., 2020
Image
|
Figure Caption
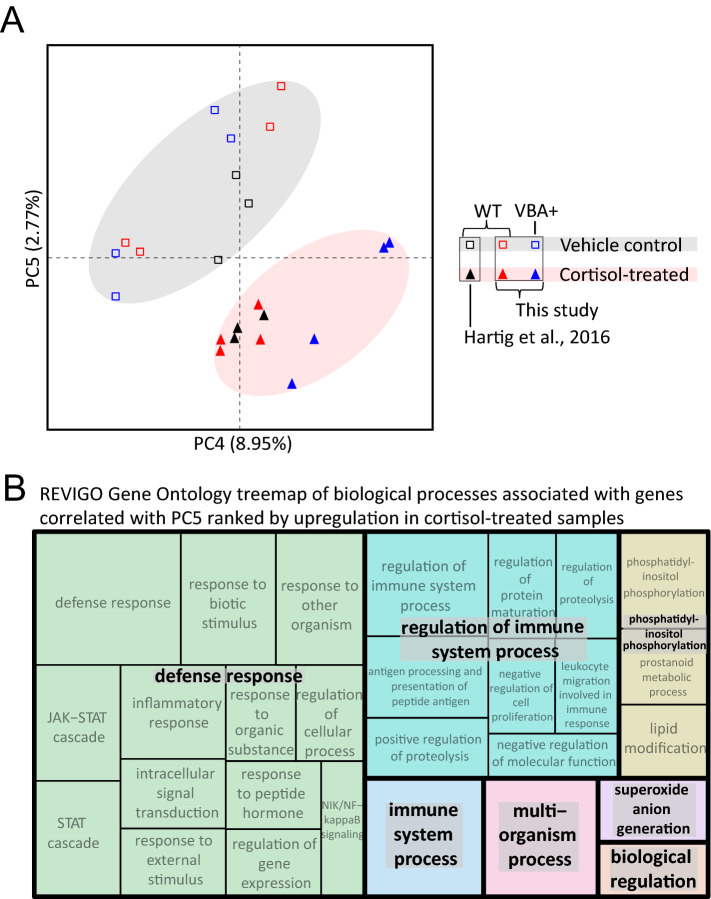
Figure 5
Combined analysis of three different RNA-seq datasets examining the transcriptomic effects of chronic cortisol exposure. (
Acknowledgments
This image is the copyrighted work of the attributed author or publisher, and
ZFIN has permission only to display this image to its users.
Additional permissions should be obtained from the applicable author or publisher of the image.
Full text @ Sci. Rep.