IMAGE

Figure 6

ID
ZDB-IMAGE-200716-59
Source
Figures for Keller et al., 2020
Image
Figure Caption

Figure 6

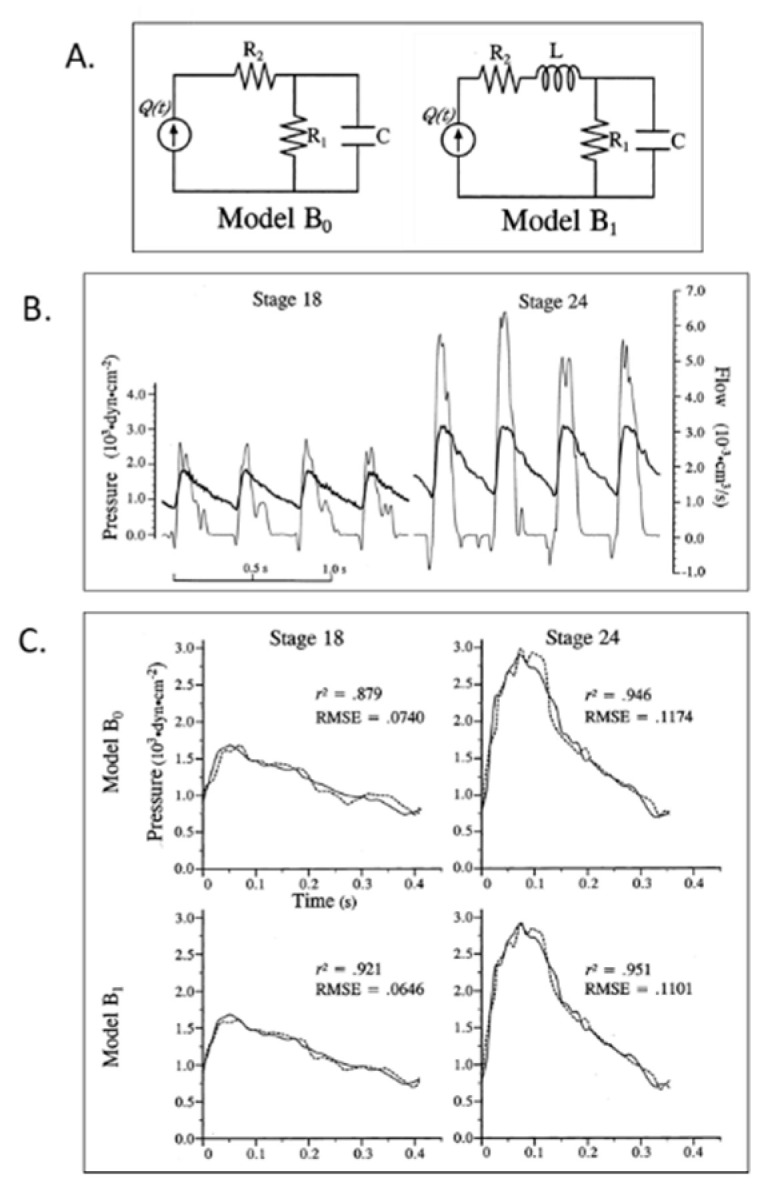
Lumped parameter Windkessel estimation of embryonic chick arterial impedance. (A) 3-element (B0) and 4-element (B1) lumped parameter models of the embryonic circulation as electrical circuit analogs; (B) representative time domain pressure and flow waveforms for stage 18 and 24 chick embryos. Bold lines represent pressure and thin lines represent blood flow data; (C) representative fit results based on models B0 and B1 for stage 18 and 24 data. Solid lines represent experimental pressure data and dashed lines represent model-predicted pressure waveforms. r2, the coefficient of determination; RMSE, root mean square error. This was reproduced with permission [102].

Acknowledgments
This image is the copyrighted work of the attributed author or publisher, and ZFIN has permission only to display this image to its users. Additional permissions should be obtained from the applicable author or publisher of the image. Full text @ J Cardiovasc Dev Dis