IMAGE

Figure 2

ID
ZDB-IMAGE-200716-3
Source
Figures for Gans et al., 2020
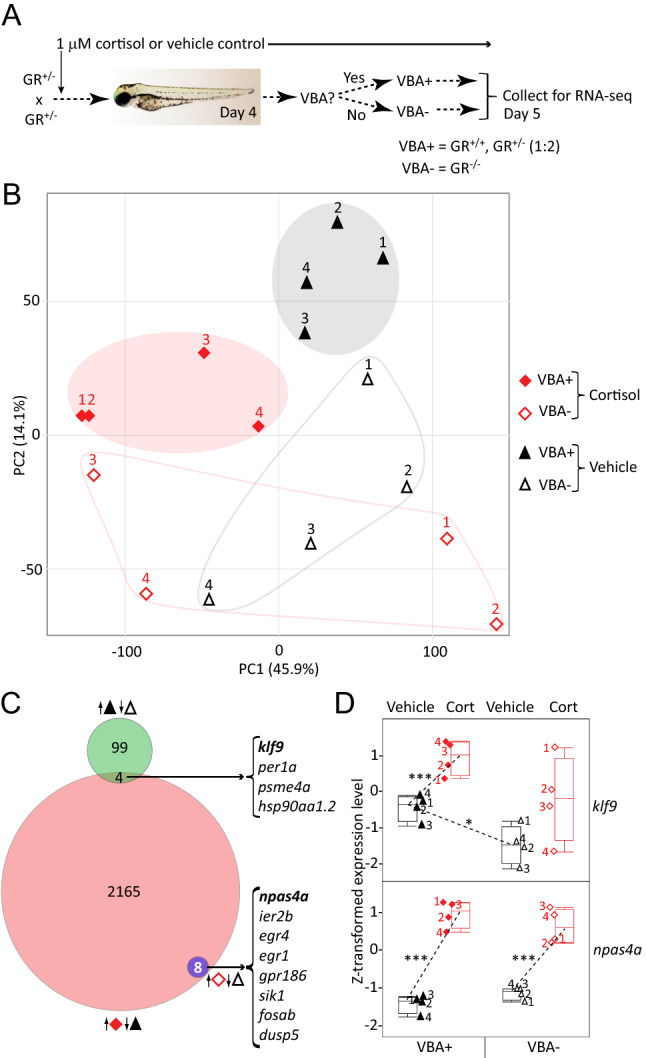
Image
Figure Caption

Figure 2

RNA-seq identifies GR-dependent and GR-independent genes and effects of chronic cortisol treatment. (A) Diagram of experimental design using Visual Background Adaptation (VBA) selection. (B) Principal component plot of the RNA-seq data, showing the location of each replicate sample with respect to the first two principal components. Cortisol-treated samples are shown in red, vehicle-treated controls in black. VBA+ samples (containing at least one functional GR allele) are filled shapes, VBA- samples are empty shapes. (C) Venn diagram showing numbers of genes upregulated in each of the indicated comparisons (keyed as in (A)): VBA+ vs. VBA- (vehicle-treated controls); cortisol-treated vs. vehicle-treated VBA+; and cortisol-treated vs. vehicle treated VBA-. Upregulated genes in common respectively between the first two and the last two comparisons are listed on the right. (D) Box plots of Z-transformed expression levels of klf9 and npas4a obtained from the RNA-seq data. Sample numbers correspond to those in (B). Asterisks indicate significant differential expression (adjusted p values): ***< .0001; *< .05.

Acknowledgments
This image is the copyrighted work of the attributed author or publisher, and ZFIN has permission only to display this image to its users. Additional permissions should be obtained from the applicable author or publisher of the image. Full text @ Sci. Rep.