
Image
|
Figure Caption
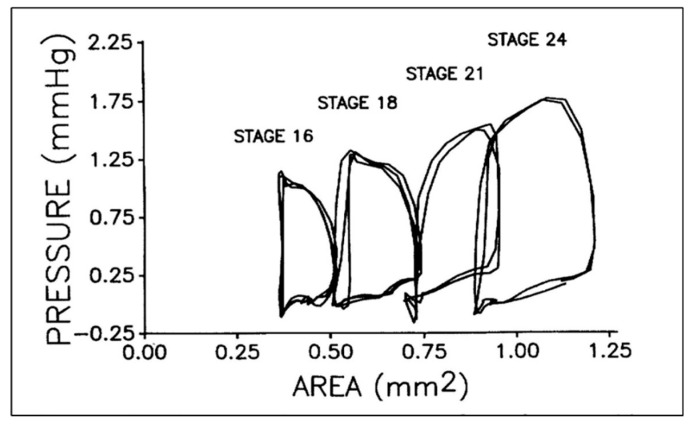
Figure 3
Representative pressure–area loops for stage 16 to 24 chick embryos. Two or three cardiac cycles are included for each stage as synchronized, raw data. This was reproduced with permission [
Acknowledgments
This image is the copyrighted work of the attributed author or publisher, and
ZFIN has permission only to display this image to its users.
Additional permissions should be obtained from the applicable author or publisher of the image.
Full text @ J Cardiovasc Dev Dis