
|
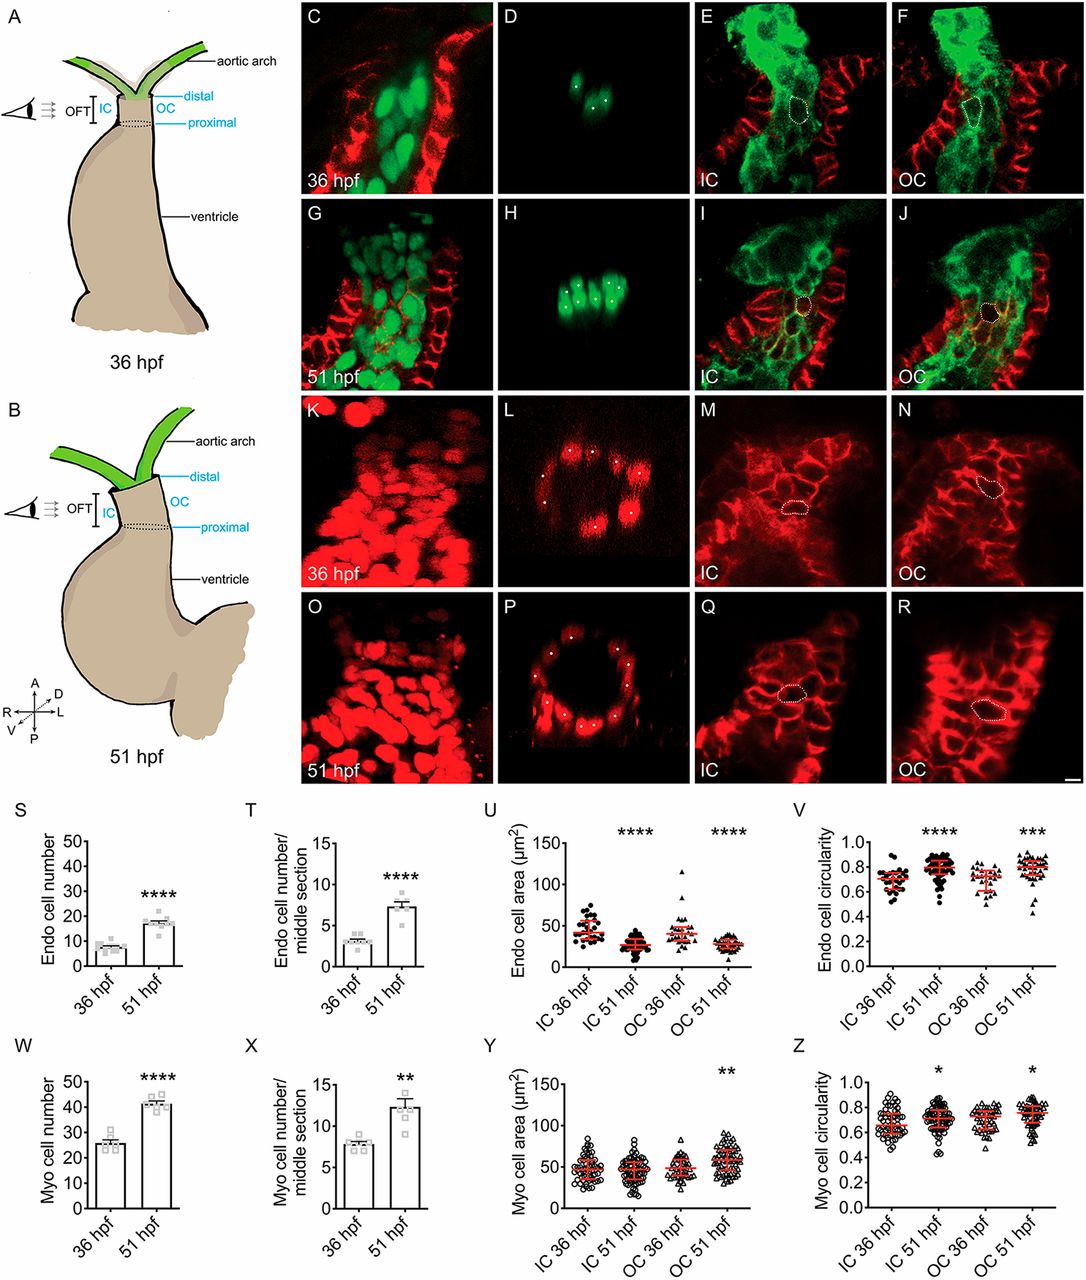
Fig. 1 Endocardial and myocardial cells accumulate as the OFT develops. (A,B) Cartoons illustrate frontal views of the wild-type heart at 36 (A) and 51 hpf (B) and highlight the IC, OC, and proximal and distal boundaries of the OFT. Eye and arrows indicate the angle of imaging used to visualize the OFT. (C,D,G,H,S,T) Immunofluorescence indicates localization of Alcama (red), which outlines myocardial cells, and expression of Tg(fli1a:negfp) (green), which labels endocardial nuclei. Lateral slices (C,G) and middle cross-sections (D,H) through the OFT demonstrate that the number of OFT endocardial cells increases between 36 (C,D) and 51 hpf (G,H), as quantified in S and T (n=12, 9 embryos analyzed in total, over the course of 3 experimental replicates (N=3); see Materials and Methods for details regarding replicates). ****P<0.0001, significant differences from 36 hpf, Student's t-test. White dots indicate GFP+ nuclei in D and H. (E,F,I,J,U,V) Immunofluorescence marks Alcama (red) and expression of Tg(kdrl:HsHRAS-mCherry) (green), which outlines endocardial cells. Partial reconstructions of the IC (E,I) and OC (F,J) endocardial walls demonstrate that endocardial cells get smaller (U) and rounder (V) over time [n=7, 9 embryos; 29 (IC 36 hpf), 59 (IC 51 hpf), 27 (OC 36 hpf), 43 (OC 51 hpf) cells; N=3; ***P<0.001, ****P<0.0001; significant differences from same wall at 36 hpf, Mann–Whitney U-test]. White dotted outlines mark representative cells. (K,L,O,P,W,X) Three-dimensional reconstructions (K,O) and middle cross-sections (L,P) of the OFT, with immunofluorescence marking expression of Tg(myl7:H2A-mCherry), which labels myocardial nuclei, indicating an increase in myocardial cell number between 36 (K,L) and 51 hpf (O,P), as quantified in W and X (n=6, 6; N=1; **P<0.01, ****P<0.0001; significant differences from 36 hpf, Student's t-test). White dots indicate mCherry+ nuclei in L and P. (M,N,Q,R,Y,Z) Partial reconstructions of the OFT myocardial walls at 36 (M,N) and 51 hpf (Q,R), marked by immunofluorescence for Alcama, indicate trends toward a more circular shape of OFT myocardial cells (Z) and enlargement of OC cells (Y) over time [n=8, 8 embryos; 57 (IC 36 hpf), 79 (IC 51 hpf), 45 (OC 36 hpf), 64 (OC 51 hpf) cells; N=2; *P<0.05, **P<0.01; significant differences from same wall at 36 hpf, Mann–Whitney U-test]. White dotted outlines mark representative cells. (S,T,W,X) Bar graphs indicate mean+s.e.m. (U,V,Y,Z) Red lines represent median and interquartile range. Scale bar: 5 μm.