IMAGE

Figure 6

ID
ZDB-IMAGE-200711-8
Source
Figures for Sun et al., 2020
Image
Figure Caption

Figure 6

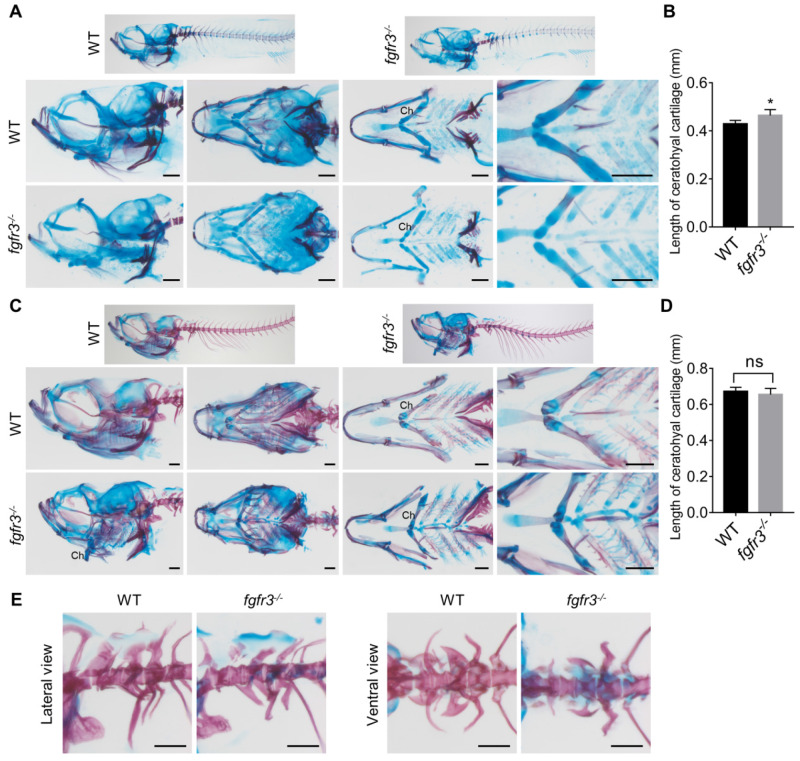
The phenotype of fgfr3 mutant zebrafish detected by Alizarin red and Alcian blue whole skeleton staining. (A, C) Alizarin red and Alcian blue whole skeleton staining of the WT and fgfr3 mutant at 20 dpf (SL 7.5 mm) (A) and 30 dpf (SL 10.0 mm) (C). Left two panels show the lateral view and dorsal view of the craniofacial bone. Right two panels show the dissected pharyngeal arches and the magnified ceratohyal bone. (B, D) Quantification of ceratohyal cartilage length for WT and fgfr3 mutants at 20 dpf (SL 7.5 mm) (B) and 30 dpf (SL 10.0 mm) (D). n = 6, *p<0.05, no significance (ns). (E) Lateral view (left) and ventral view (right) of the Weberian apparatus of the WT and fgfr3 mutant at 30 dpf (SL 10.0 mm). Ch: ceratohyal cartilage. Scale bar, 200 µm in A, C and E.

Figure Data
Acknowledgments
This image is the copyrighted work of the attributed author or publisher, and ZFIN has permission only to display this image to its users. Additional permissions should be obtained from the applicable author or publisher of the image. Full text @ Theranostics