
|
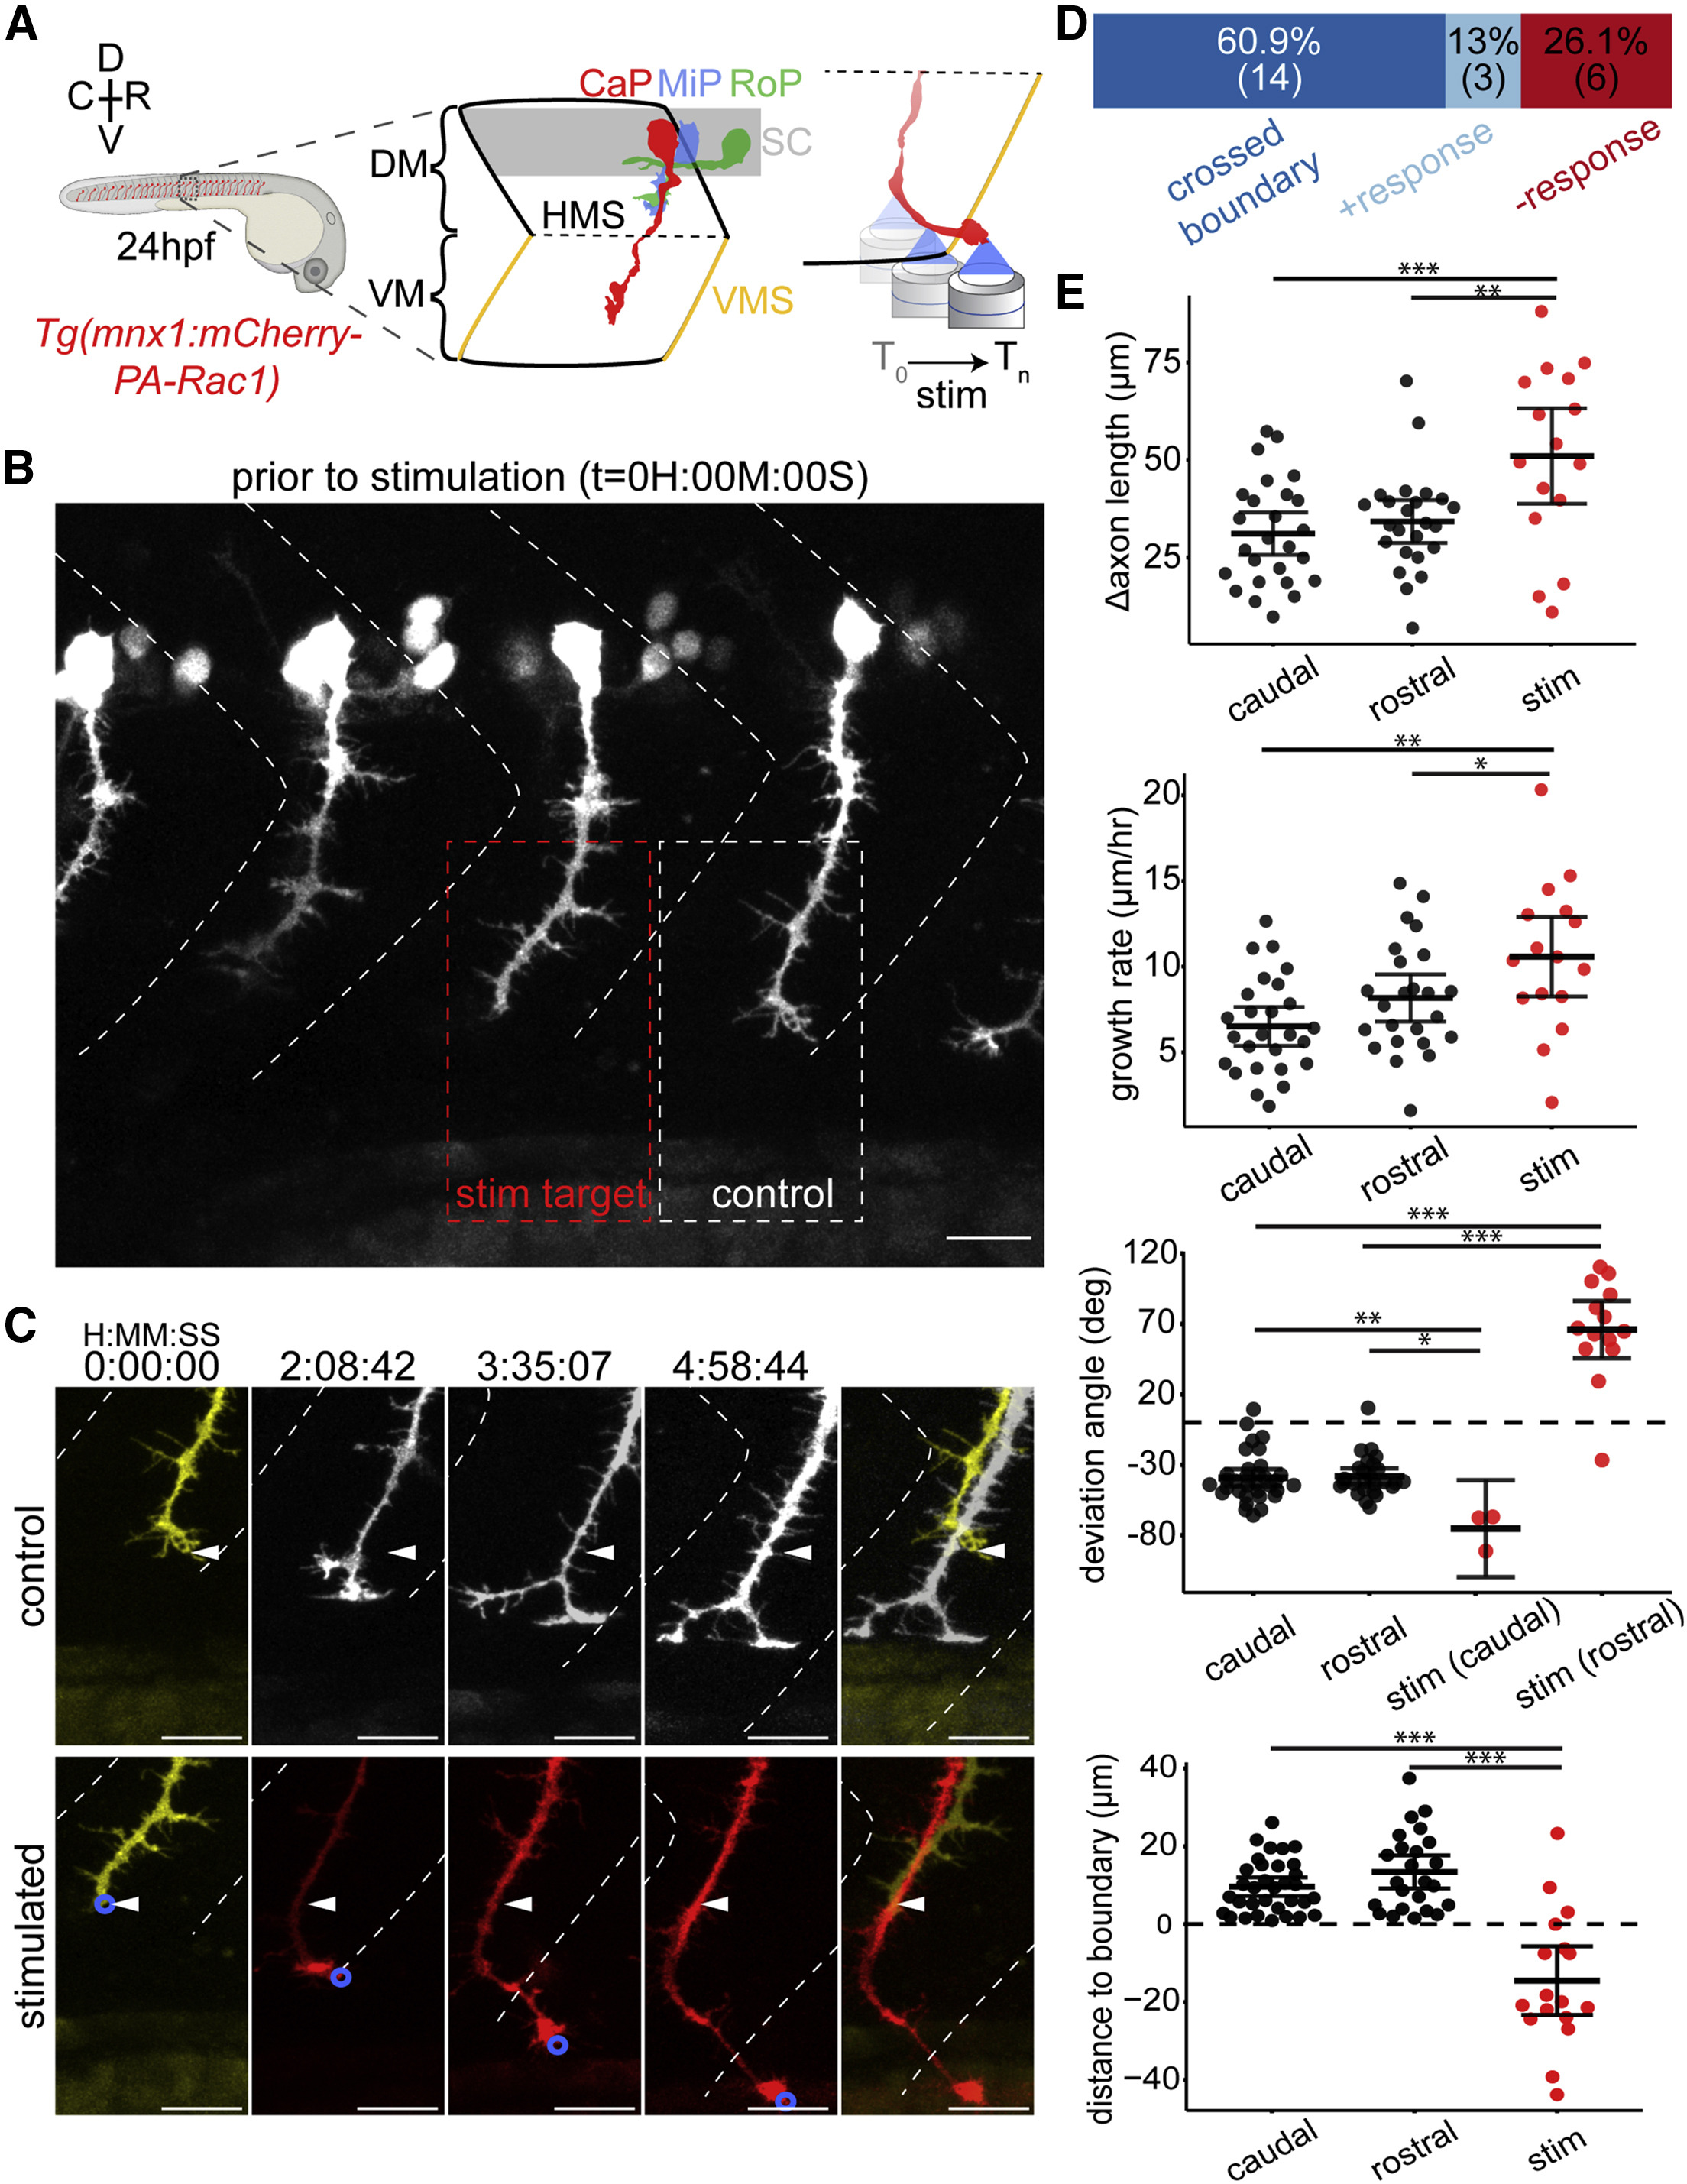
Fig. 2 Optogenetic Stimulation of PA-Rac1 Directs Zebrafish CaP Axon Growth across the Repulsive Somitic Boundary into the Neighboring Somitic Musculature (A) Schematic of experimental design: zebrafish expressing PA-Rac1 in CaP neurons (left) were illuminated at the leading edge of the growth cone from 24 to 29 hpf (right). (B) Position of axons prior to stimulation. All CaP neurons were within the somitic boundaries (dashed white chevrons). A single CaP axonal growth cone per fish (red box) was asymmetrically illuminated, whereas other CaP neurons, including the rostral neighbor (white box), remained unilluminated (scale bar, 20 μm). (C) Time series of CaP axons in an unstimulated rostral axon (upper series, corresponding to white dashed box in B) and illuminated CaP axon (lower series, corresponding to red box in B). The stimulated axon was guided across the rostral somitic boundary, whereas the unstimulated axon remained entirely within its native somite (arrowheads indicate the initial position of the axon; scale bar, 20 μm). (D) Distribution of outcomes of optogenetic stimulation. Axons either grew across repulsive vertical myosepta boundaries in response to illumination (dark blue, crossed boundary), grew in the direction of illumination but did not cross the vertical myosepta (light blue, + response), or did not alter their growth trajectory following illumination (red, - response). (E) PA-Rac1-mediated guidance of CaP axons in vivo resulted in significantly longer axons over the trial period, corresponding to faster axonal growth (top two graphs, respectively, n = 16 axons, one axon per zebrafish). The angle of axon growth deviated significantly in both the rostral and caudal directions from their initial trajectory compared with unilluminated controls (middle). Stimulated axons were guided across the somitic boundary, which control axons never crossed (bottom, negative values indicate growth across the somitic boundary, [FDR adjusted, difference of least square means from mixed linear model, n = 17 axons, one axon per fish, ∗p < 0.05, ∗∗p < 0.01, ∗∗∗p < 0.001], mean and 95% CIs shown). R, rostral; C, caudal; D, dorsal; V, ventral; DM, dorsal myotome; SC, spinal cord; VM, ventral myotome; HMS, horizontal myoseptum; VMS, vertical myoseptum; CaP, MiP, and RoP, caudal, middle, and rostral primary spinal motor neurons, respectively. See also Figure S1; Video S2.
Reprinted from Developmental Cell, 53, Harris, J.M., Wang, A.Y., Boulanger-Weill, J., Santoriello, C., Foianini, S., Lichtman, J.W., Zon, L.I., Arlotta, P., Long-Range Optogenetic Control of Axon Guidance Overcomes Developmental Boundaries and Defects, 577-588.e7, Copyright (2020) with permission from Elsevier. Full text @ Dev. Cell