
|
Fig 1
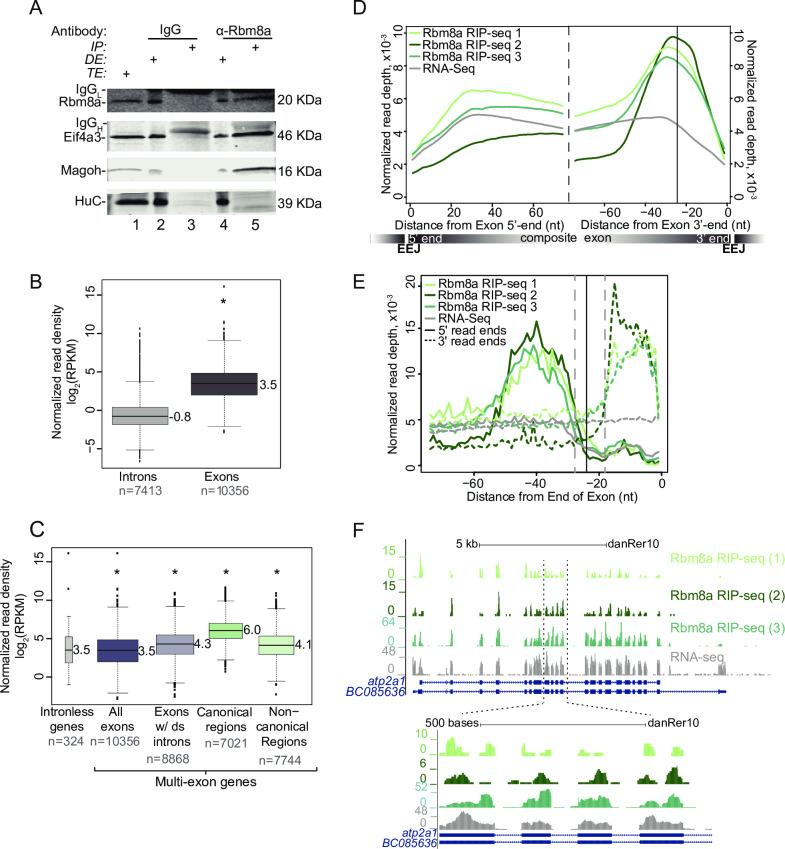
A. Western blot indicating Rbm8a, Eif4a3, Magoh and HuC proteins detected in RNase I-treated zebrafish embryo total extract (TE, lane 1), depleted extract (DE, lanes 2 and 4) immunoprecipitated protein complexes (IP, lanes 3 and 5). Antigens detected in the blot are listed on the left and antibodies used to immunoprecipitate complexes are listed on top. The signal corresponding to the antibody light chain and heavy chain in the IP lanes is indicated by IgGL and IgGH, respectively. B. Boxplots showing the Rbm8a RIP-Seq normalized read densities (reads per kilobase per million, RPKM) in intronic versus exonic genomic regions. Asterisk at the top indicates Wilcoxon test p-value, which is < 10−6. C. Boxplots as in B showing the Rbm8a RIP-Seq normalized read densities (RPKM) in the indicated genomic regions (bottom). Exons with downstream introns include all but last exons. Asterisk at the top indicates Wilcoxon test p-values, which are < 10−6. D. Meta-exon plots showing Rbm8a RIP-Seq and RNA-Seq (indicated on the top left) normalized read depths in a 75 nt region starting from the exon 5′ (left of dashed black line) or 3′ ends (right of dashed black line). Vertical black line: expected canonical EJC binding site (-24 nt) based on human studies. A composite exon with the relative position of exon-exon junctions (EEJ) is diagrammed at the bottom. E. A meta-exon plot of start and end of Rbm8a RIP-Seq or RNA-Seq reads (indicated on the top left; 5′ ends, solid lines; 3′ ends, dotted lines). Vertical black line: canonical EJC site (-24 nt). Gray vertical dashed lines represent boundaries of the minimal EJC occupied site. F. Top: UCSC genome browser screenshots showing read coverage along the