IMAGE

Fig. 5

ID
ZDB-IMAGE-200622-16
Source
Figures for Rebelo de Almeida et al., 2020
Image
Figure Caption

Fig. 5 Bevacizumab can modulate early and late metastatic steps.

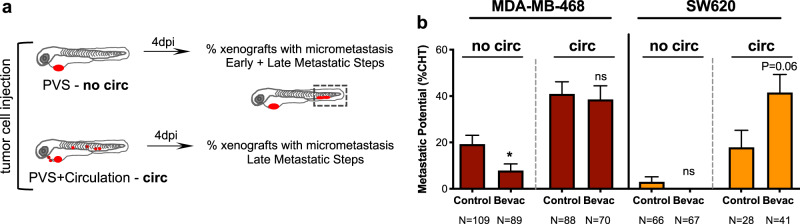
Schematic representation to distinguish between early and late metastatic steps (a). Injected xenografts were sorted into two groups—xenografts with only cells in the PVS and xenografts with cells in circulation. MDA-MB-468 and SW620 micrometastasis in the CHT region were quantified from both groups (b, MDA-MB-468 *P = 0.0246 and SW620 P = 0.06). Results are from 2 independent experiments and outcomes are expressed as AVG ± SEM. The number of xenografts analyzed are indicated  below the graphs. Statistical analysis was performed using a Fisher’s exact test. Statistical results: (ns) > 0.05, *P ≤ 0.05, **P ≤ 0.01, ***P ≤ 0.001, ****P ≤ 0.0001.

Acknowledgments
This image is the copyrighted work of the attributed author or publisher, and ZFIN has permission only to display this image to its users. Additional permissions should be obtained from the applicable author or publisher of the image. Full text @ Commun Biol