IMAGE

Fig. 3

ID
ZDB-IMAGE-200622-14
Source
Figures for Rebelo de Almeida et al., 2020
Image
Figure Caption

Fig. 3 Bevacizumab reduces angiogenesis and promotes vessel normalization.

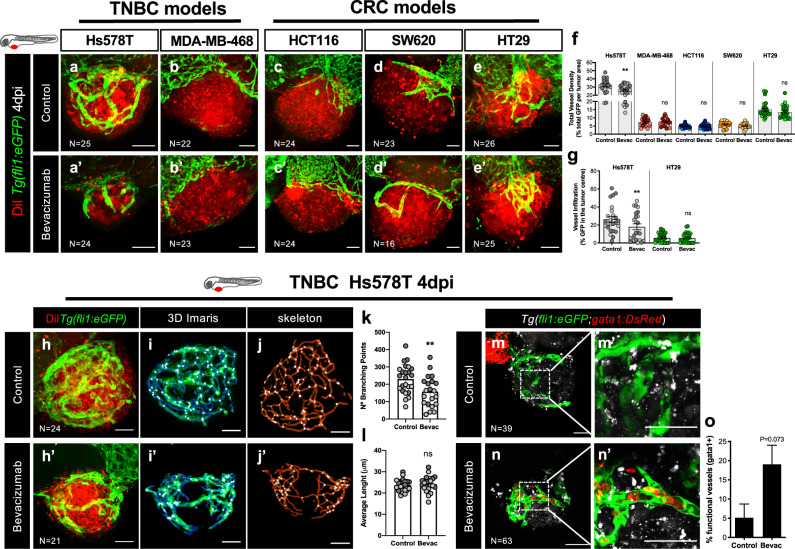
Human cancer cell lines (Hs578T, MDA-MB-468, HCT116, SW620 or HT29) were fluorescently labeled with DiI (in red) and injected into the PVS of 2 dpf Tg(fli1:eGFP) zebrafish larvae. Zebrafish xenografts were treated in vivo with bevacizumab and compared with untreated controls. At 4 dpi, zebrafish xenografts vasculature was imaged by confocal microscopy (max Z-projections) (ae’). Total vessel density (f, **P = 0.0023) and vessel infiltration (g, **P = 0.0027) were quantified. Filament analysis was performed in Hs578T tumor-related vasculature. Hs578T xenografts confocal images of untreated and Bevacizumab-treated (h, h’) were used to perform 3D projections using Imaris (ii’) and skeletonized images on ImageJ (j–j’). Number of branching points (k, **P = 0.007) and average vessel length (l, P = 0.61) were quantified by filament analysis. To analyze the functionality of Hs578T tumor-related vessels, tumor cells were labeled with DeepRed (in gray) to generate xenografts in Tg(fli1:eGFP; gata1:DsRed) zebrafish larvae. Xenografts were treated in vivo with bevacizumab and compared with untreated controls. At 4 dpi, zebrafish xenografts were mounted in low melting agarose to be visualized by live-imaging confocal microscopy (mn’). The percentage of xenografts with erythrocytes inside blood vessels was quantified (o). All outcomes are expressed as AVG ± SEM. The number of xenografts analyzed are indicated in the representative images and each dot represents one zebrafish xenograft. Results are from 2 independent experiments, which are highlighted in different colors corresponding to each individual experiment. Statistical analysis was performed using an unpaired t-test or Fisher’s exact test. Statistical results: (ns) > 0.05, *P ≤ 0.05, **P ≤ 0.01, ***P ≤ 0.001, ****P ≤ 0.0001. Scale bars represent 50 μm. All images are anterior to the left, posterior to right, dorsal up and ventral down.

Acknowledgments
This image is the copyrighted work of the attributed author or publisher, and ZFIN has permission only to display this image to its users. Additional permissions should be obtained from the applicable author or publisher of the image. Full text @ Commun Biol