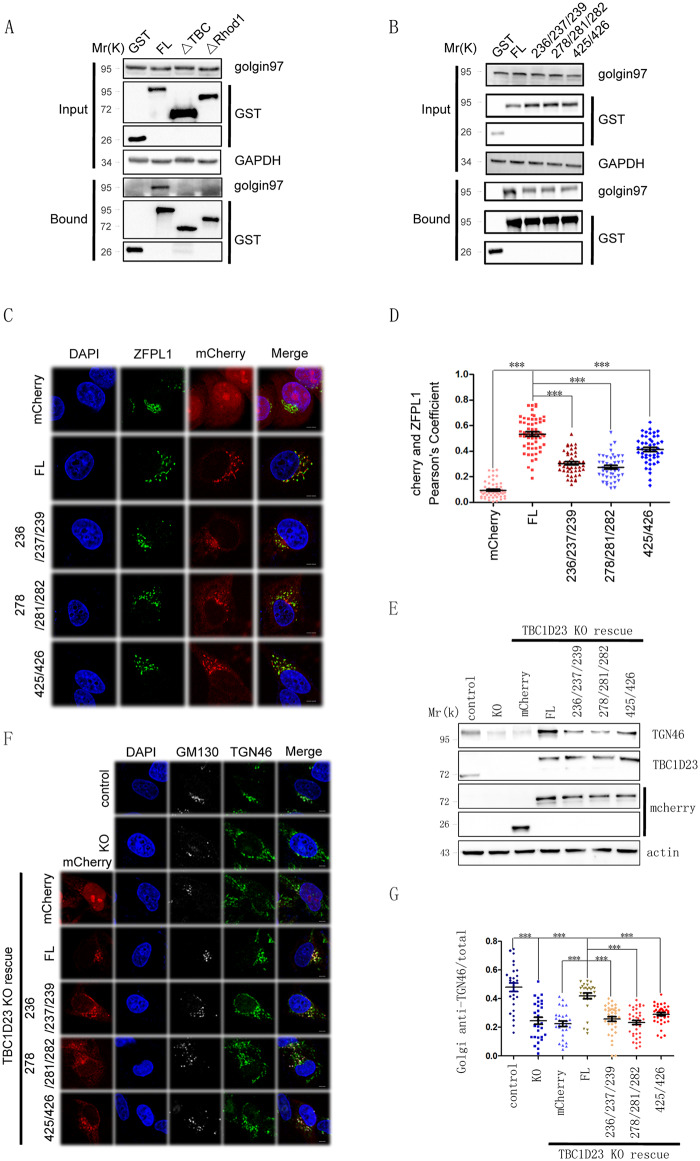
IMAGE

Fig 5

ID
ZDB-IMAGE-200612-12
Source
Figures for Liu et al., 2020
Image
Figure Caption

Fig 5 Mutations that weaken golgin-97/245-binding impair subcellular localization and functions of TBC1D23.

(A) GST pull-down analyses of HEK 293T cells transfected with vectors expressing GST, GST-TBC1D23-FL (“FL”), GST-TBC1D23-ΔTBC (deleting aa1–330), or GST-TBC1D23-ΔRhod1 (deleting aa331–513). Cell lysates were precipitated with glutathione-Sepharose beads and probed with anti-GST, golgin-97, or GAPDH (control) antibodies. (B) GST pull-down analyses of HEK 293T cells transfected with vectors expressing GST, GST-TBC1D23-FL (“FL”), TBC1D23-L278A/Y281A/Y282A (“278/281/282”), TBC1D23-I236A/I237A/V239A (“236/237/239”), or TBC1D23-E425K/Y426A (“425/426”). Cell lysates were precipitated with glutathione-Sepharose beads and probed with anti-GST, golgin-97, or GAPDH (control) antibodies. (C) HeLa cells were transfected with mCherry, or mCherry-TBC1D23 FL (“FL”), TBC1D23-L278A/Y281A/Y282A (“278/281/282”), TBC1D23-I236A/I237A/V239A (“236/237/239”), or TBC1D23-E425K/Y426A (“425/426”) and then fixed and labeled with anti-ZFPL1 (blue) antibody. Scale bar: 10 μm. (D) Quantitation of mCherry colocalization with ZFPL1 (Golgi marker) in cells as treated in (C). Each dot represents Pearson’s correlation coefficients from one cell. P values were calculated using one-way ANOVA, post hoc Tukey’s test. ***P < 0.001. Experiments were triplicated, and the numerical data are included in S1 Data. (E) Immunoblot of whole-cell extracts of parental HeLa Cells (control), TBC1D23 KO cells (“KO”), TBC1D23 KO cells transfected with vectors expressing mCherry, mCherry-TBC1D23-FL (“FL”), TBC1D23-L278A/Y281A/Y282A (“278/281/282”), TBC1D23-I236A/I237A/V239A (“236/237/239”), or TBC1D23-E425K/Y426A (“425/426”). Cell lysates were probed with anti-cherry, TBC1D23, TGN46, or actin (control) antibodies. (F) Confocal immunofluorescence of TBC1D23 KO HeLa cells transfected with vectors expressing mCherry, mCherry-TBC1D23-FL (“FL”), TBC1D23-L278A/Y281A/Y282A (“278/281/282”), TBC1D23-I236A/I237A/V239A (“236/237/239”), or TBC1D23-E425K/Y426A (“425/426”). The cells were fixed and labeled with anti-TGN46 (green) and GM130 (white) antibodies. Scale bar: 10 μm. (G) Quantitation of Golgi-localized TGN46 over its total amount in cells treated as in (F). Each dot represents results from one cell. P values were calculated using one-way ANOVA, post hoc Tukey’s test. ***P < 0.001. Experiments were triplicated, and the numerical data are included in S1 Data. aa, amino acid; FL, full-length; GAPDH, glyceraldehyde 3-phosphate dehydrogenase; GST, glutathione S-transferase; HEK, human embryonic kidney; KO, knockout; TBC, Tre2-Bub2-Cdc16; TGN, trans-Golgi network; ZFPL1, zinc finger protein like 1.

Acknowledgments
This image is the copyrighted work of the attributed author or publisher, and ZFIN has permission only to display this image to its users. Additional permissions should be obtained from the applicable author or publisher of the image. Full text @ PLoS Biol.