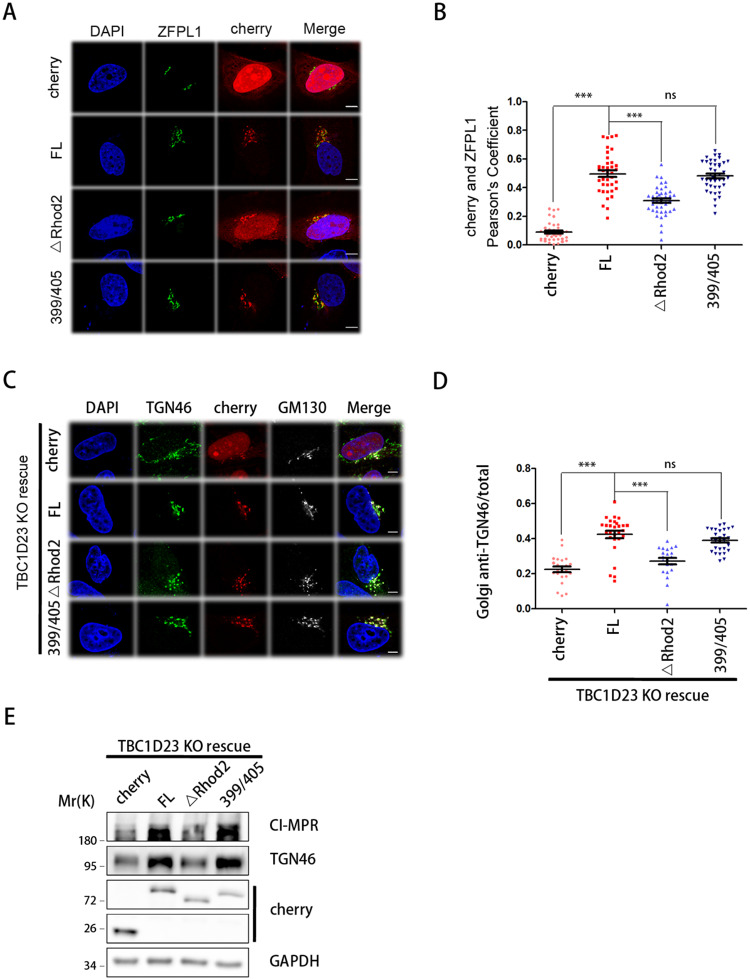
IMAGE

Fig 3

ID
ZDB-IMAGE-200612-10
Source
Figures for Liu et al., 2020
Image
Figure Caption

Fig 3 The rhodanese domain, but not residues 399/405, is required for the subcellular localization and functions of TBC1D23.

(A) HeLa cells were transfected with mCherry or mCherry-TBC1D23 FL (“FL”), ΔRhod2 (deleting aa331–460), or C399S/R405A (399/405) and then fixed and labeled with anti-ZFPL1 (Golgi marker, green) antibody. Scale bar: 10 μm. (B) Quantitation of mCherry colocalization with ZFPL1 in cells as treated in (A). Each dot represents Pearson’s correlation coefficients from one cell. P values were calculated using one-way ANOVA, post hoc Tukey’s test. ***P < 0.001. Experiments were triplicated, and the numerical data are included in S1 Data. (C) TBC1D23-KO HeLa cells were transfected with mCherry or FL, ΔRhod2, or 399/405 and then fixed and labeled with anti-TGN46 (green) and GM130 (Golgi marker, white) antibodies. TGN46 is recycled between endosomes and Golgi in a TBC1D23-dependent manner. Scale bar: 10 μm. (D) Quantitation of Golgi-localized TGN46 over its total amount in cells treated as in (C). Each dot represents results from one cell. P values were calculated using one-way ANOVA, post hoc Tukey’s test. ***P < 0.001. Experiments were triplicated, and the numerical data are included in S1 Data. (E) Immunoblot of whole-cell extracts showing the total protein level of CI-MPR and TGN46 in cells treated in (C). aa, amino acid; CI-MPR, cation-independent mannose-6-phosphate receptor; FL, full-length; GAPDH, glyceraldehyde 3-phosophate dehydrogenase; KO, knockout; ns, not significant; TGN, trans-Golgi network; ZFPL1, zinc finger protein like 1.

Acknowledgments
This image is the copyrighted work of the attributed author or publisher, and ZFIN has permission only to display this image to its users. Additional permissions should be obtained from the applicable author or publisher of the image. Full text @ PLoS Biol.