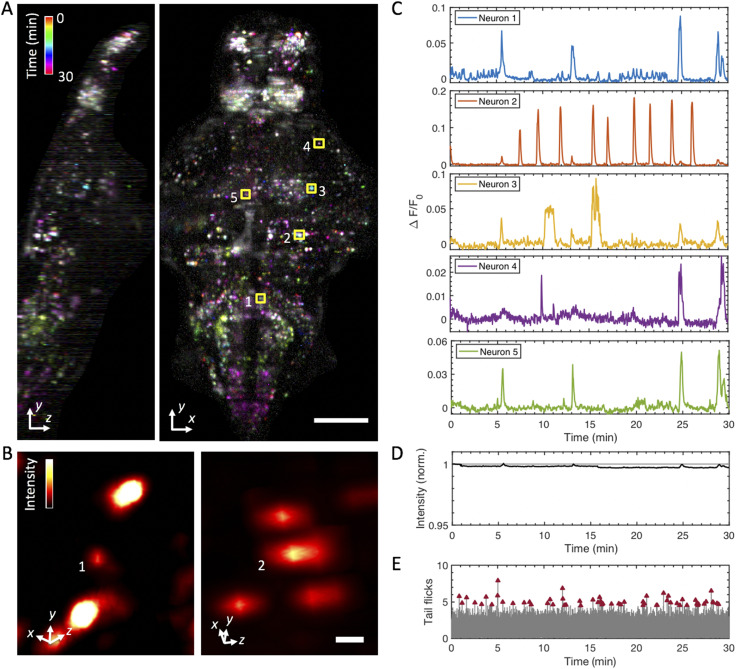
IMAGE

FIG. 12.

ID
ZDB-IMAGE-200606-12
Source
Figures for Keomanee-Dizon et al., 2020
Image
Figure Caption

FIG. 12.

Whole-brain functional imaging at single-cell resolution in behaving 5-dpf transgenic larval zebrafish expressing nuclear-localized calcium indicator elavl3:H2B-GCaMP6s. (a) Maximum-intensity projections of calcium activity are color-coded in time over the 30-min recording window. Active neurons that exhibit fluorescence change during the recording appear as colored dots. Volume of 400 × 800 × 250 (xyz) μm3 was sampled by 52 z-planes (4.8 µm z-steps) at 0.5 Hz and 11× magnification. Figure 13 (Multimedia view) shows a 3D rendered movie of the same specimen. (b) Magnified volume renderings of neuron 1 (left) and neuron 2 (right) outlined in the xy projection in (a), demonstrating cellular resolution in whole-brain 2P-SPIM imaging. The standard deviation projection along the temporal axis was used to generate the renderings, and a false-color (hot) lookup table was used to aid visualization. (c) Representative single-neuron activity traces extracted from the whole-brain recordings, calculated as ∆F/F from the manually selected neurons in (a). (d) Plot shows the total sum intensity of the entire imaged volume as a function of time, normalized to the average intensity of the first 5 min of acquisition (gray line at y = 1). Total intensity exhibits less than a 0.5% decrease in magnitude after the 30-min recording window, indicating that photobleaching is negligible. (e) Analysis of tail flick behavior as a function of time. Tail flicks (movements) obtained by taking the absolute difference in the pixel intensities from the tail region of the wide-field view of the sample, as shown in Fig. 5(b), normalized by the average image intensity corresponding to when there is no tail movement (gray lines). A threshold was applied to classify tail flicks and subsequently confirmed by manual inspection. Tail flicks (red arrowheads), indicating intended swimming behavior, occur throughout the recorded time window (average of ∼9 flicks ±2.2 every 5 min), thus suggesting minimal stress from the imaging conditions used. Scale bars: (a) 100 µm and (b) 5 µm.

Acknowledgments
This image is the copyrighted work of the attributed author or publisher, and ZFIN has permission only to display this image to its users. Additional permissions should be obtained from the applicable author or publisher of the image. Full text @ Rev. Sci. Instrum.