
|
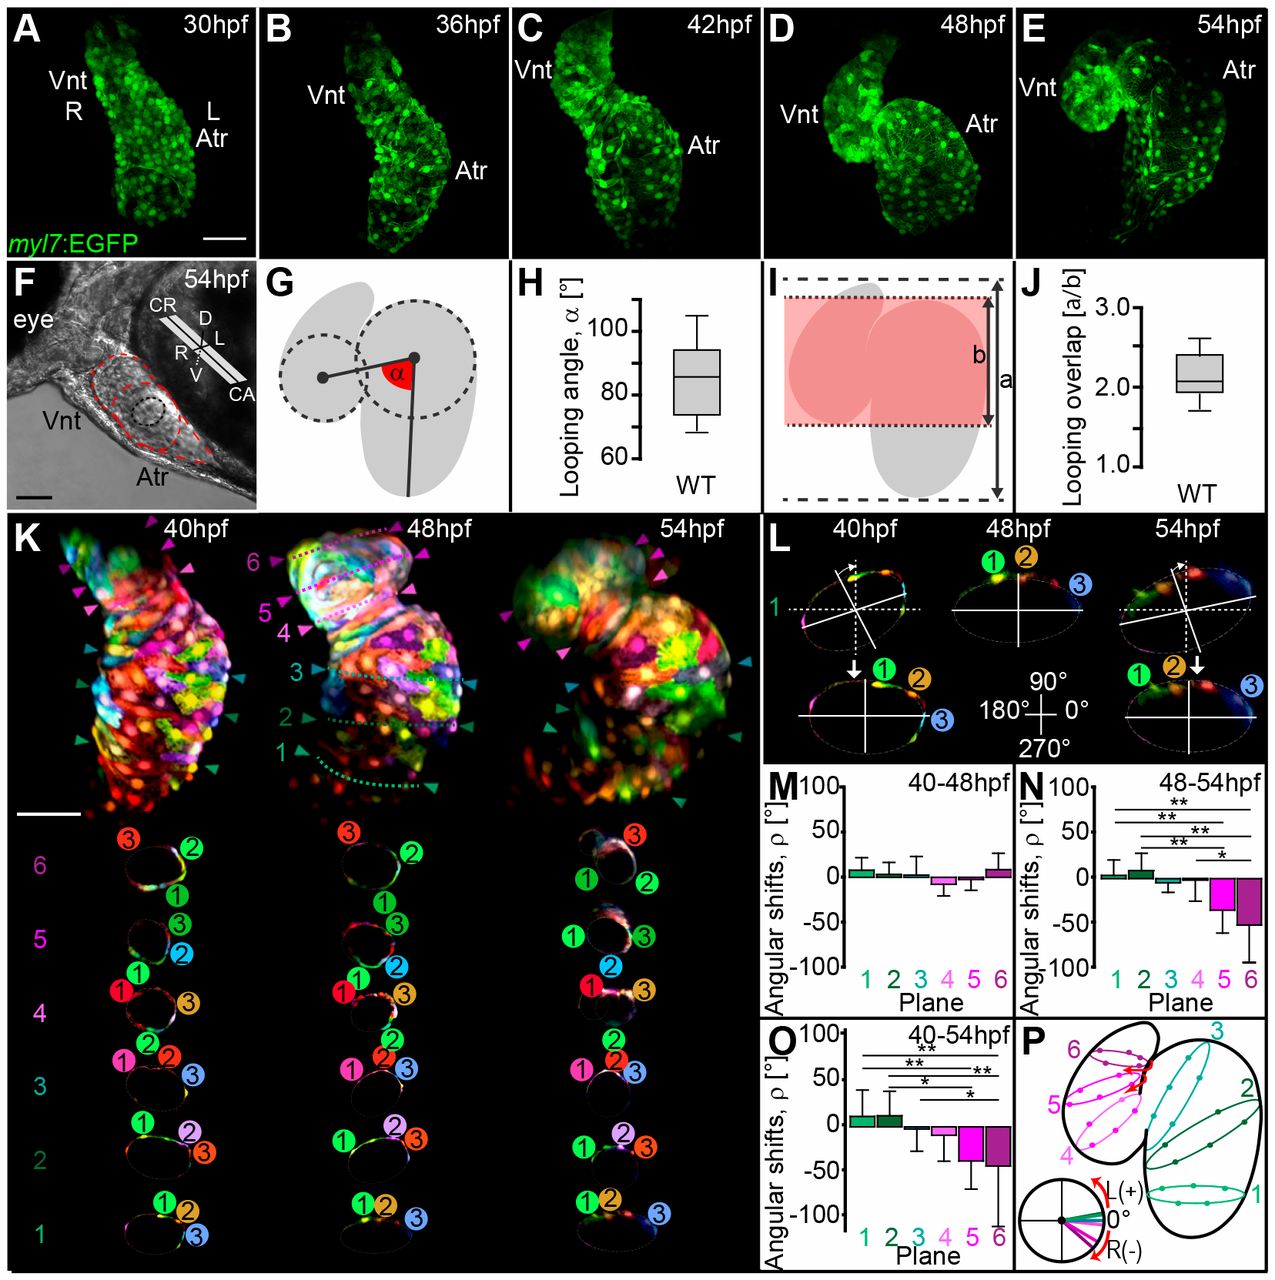
Fig. 1 Zebrafish cardiac S-looping involves planar bending and torsional winding of the heart tube. (A-E) Reconstructions of confocal z-stacks of representative wild-type hearts expressing EGFP within myocardial tissue [Tg(mly7:EGFP)twu34] during cardiac looping stages at 30-54 hpf. (A-C) Early S-looped hearts and (D,E) advanced S-looped hearts. (F) Light microscopic image showing the positioning of the heart within the embryonic body axes at 54 hpf. (G,I) Schematic models illustrating how ‘heart bending extension’ was quantified at 54 hpf. (G) Scheme of looping angle (α, red angle). (I) The index a/b (red shading indicates overlap of heart chambers). (H,J) Looping angles (α) and index a/b of wild-type hearts at 54 hpf. The limits of the boxes indicate the range between the first quartile (25th percentile) and the third quartile (75th percentile). The line inside box indicate the median value. The error bars indicate the maximum and minimum values. (K-P) Zebrafish cardiac looping morphogenesis involves torsion of the heart. (K) Reconstruction of confocal z-scan images taken from a time series (40-54 hpf). In vivo multi-color mosaic-labeling based on 1- to 4-cell stage plasmid injections into Tg(myl7:EGFP)twu34 transgenic zebrafish (false-colored red). At least three myocardial cells within each cross-section plane were tracked during looping morphogenesis. One reference plane was used to ensure the consistent orientation of the imaged hearts at 40, 48 and 54 hpf. (L) Representative angular realignment of cross-section plane 1. Cross-section planes at 40 and 54 hpf were reoriented to align with the orientation of the cross-section plane at 48 hpf. Angular shifts (ρ) for each plane were calculated based on these realignments. (M-O) Quantifications of the heart torsion based on calculations of ρ for each cross-section plane occurring during (M) 40-48 hpf, (N) 48-54 hpf and (O) 40-54 hpf. (P) Schematic representation showing right-angular shifts [R(−)] close to the outflow tract of the ventricle (planes 5 and 6). All values are mean±s.d (Table S2A); *P≤0.05; **P≤0.01 (Table S2B). Atr, atrium; Vnt, ventricle; CR, cranial; CA, caudal; D, dorsal; V, ventral; L, left; R, right; L(+), left-angular shift; R(−), right angular shift. Scale bars: 50 μm in A-E,K; 100 μm in F.