
|
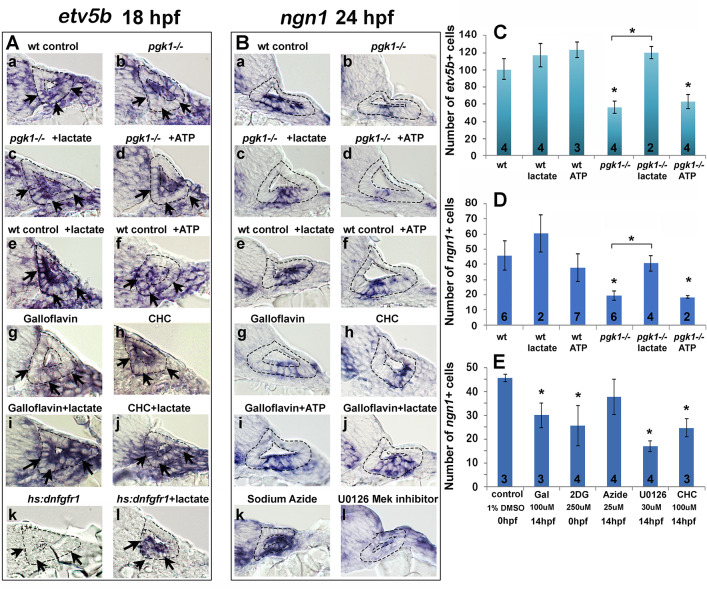
Figure 6
Exogenous lactate reverses the effects of disrupting aerobic glycolysis.
(A, B) Cross sections through the anterior/vestibular portion of the otic vesicle (outlined) showing expression of etv5b at 18 hpf (A) and ngn1 at 24 hpf (B) in embryos with the indicated genotype or drug treatment. Arrows in (A) highlight expression in the ventromedial otic epithelium. (C) Mean and standard deviation of the number of etv5b+cells in the ventral half of the otic vesicle counted from serial sections of embryos with the indicated genotype or drug treatment. (D, E) Mean and standard deviation of the number of ngn1+ cells in the floor of the otic vesicle counted from serial sections of embryos with the indicated genotype or drug treatment. Asterisks indicate significant differences (p<0.05) from wild-type controls, or between groups indicated by brackets.