
|
Figure 6
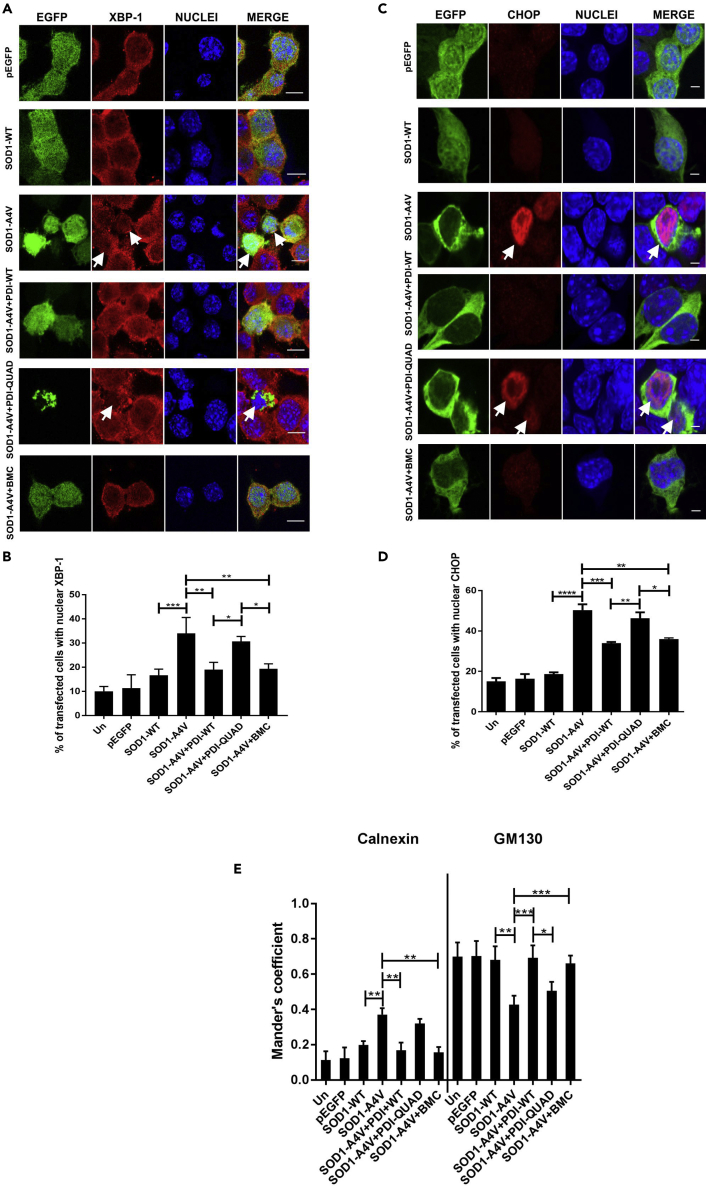
The Oxidoreductase Activity of PDI Is Protective against ER Stress and Inhibition of ER-Golgi Transport Induced by Mutant SOD1
(A) Detection of nuclear immunoreactivity to XBP-1 (second column) in EGFP (row 1), SOD1-WT (row 2) or SOD1-A4V (row 3) cells, co-expressing either PDI-WT or PDI-QUAD, or treated with BMC (rows 4, 5, 6), arrows represent XBP-1 activation.
(B) Fewer cells expressing nuclear XBP-1 were present when PDI-WT was co-expressed or cells were treated with BMC (∗∗p < 0.01). There was a significant difference between SOD1-WT and SOD1-A4V cells (∗∗∗p<0.001). Similarly, a significant difference was observed between SOD1-A4V cells co-expressing PDI-WT or PDI-QUAD, and SOD1-A4V cells co-expressing PDI-QUAD or treated with BMC (∗p < 0.05).
(C) Immunofluorescence detection of nuclear immunoreactivity to CHOP (second column) in cells expressing EGFP (row 1), SOD1-WT only (row 2), or SOD1-A4V (row 3) with PDI-WT or PDI-QUAD, or treated with BMC (rows 4, 5, 6), arrows represent CHOP activation.
(D) The proportion of cells expressing nuclear CHOP was significantly decreased when PDI-WT was co-expressed with SOD1-A4V (∗∗∗p < 0.001) or treated with BMC (∗∗p < 0.01). There was significant difference between SOD1-WT and SOD1-A4V cells (∗∗∗∗p<0.0001). Significant differences were also detected between SOD1-A4V cells co-expressing PDI-WT and PDI-QUAD (∗∗p < 0.01), and SOD1-A4V cells co-expressing PDI-QUAD or treated with BMC (∗p < 0.05).
(E) PDI's oxidoreductase activity rescues inhibition of ER-Golgi transport induced by mutant SOD1. Quantification of the degree of co-localization of VSVGts045 with the ER and Golgi compartments using Mander's coefficient following immunocytochemistry for calnexin and GM130. Data are presented as mean ± SEM, n = 20. More co-localization between VSVGts045and the ER (calnexin) was observed (∗∗p < 0.01) in SOD1-A4V cells compared with those co-expressing PDI-WT or treated with BMC. More SOD1-A4V and PDI-WT co-expressing cells, or those treated with BMC, displayed co-localization between VSVGts045 and the Golgi (GM130) (∗∗∗p < 0.001). Similarly, there was a significant difference in Golgi localisation between cells expressing PDI-WT and PDI-QUAD (∗p < 0.05).
Scale bars: 10 μm in (A), 4 μm in (C).