
|
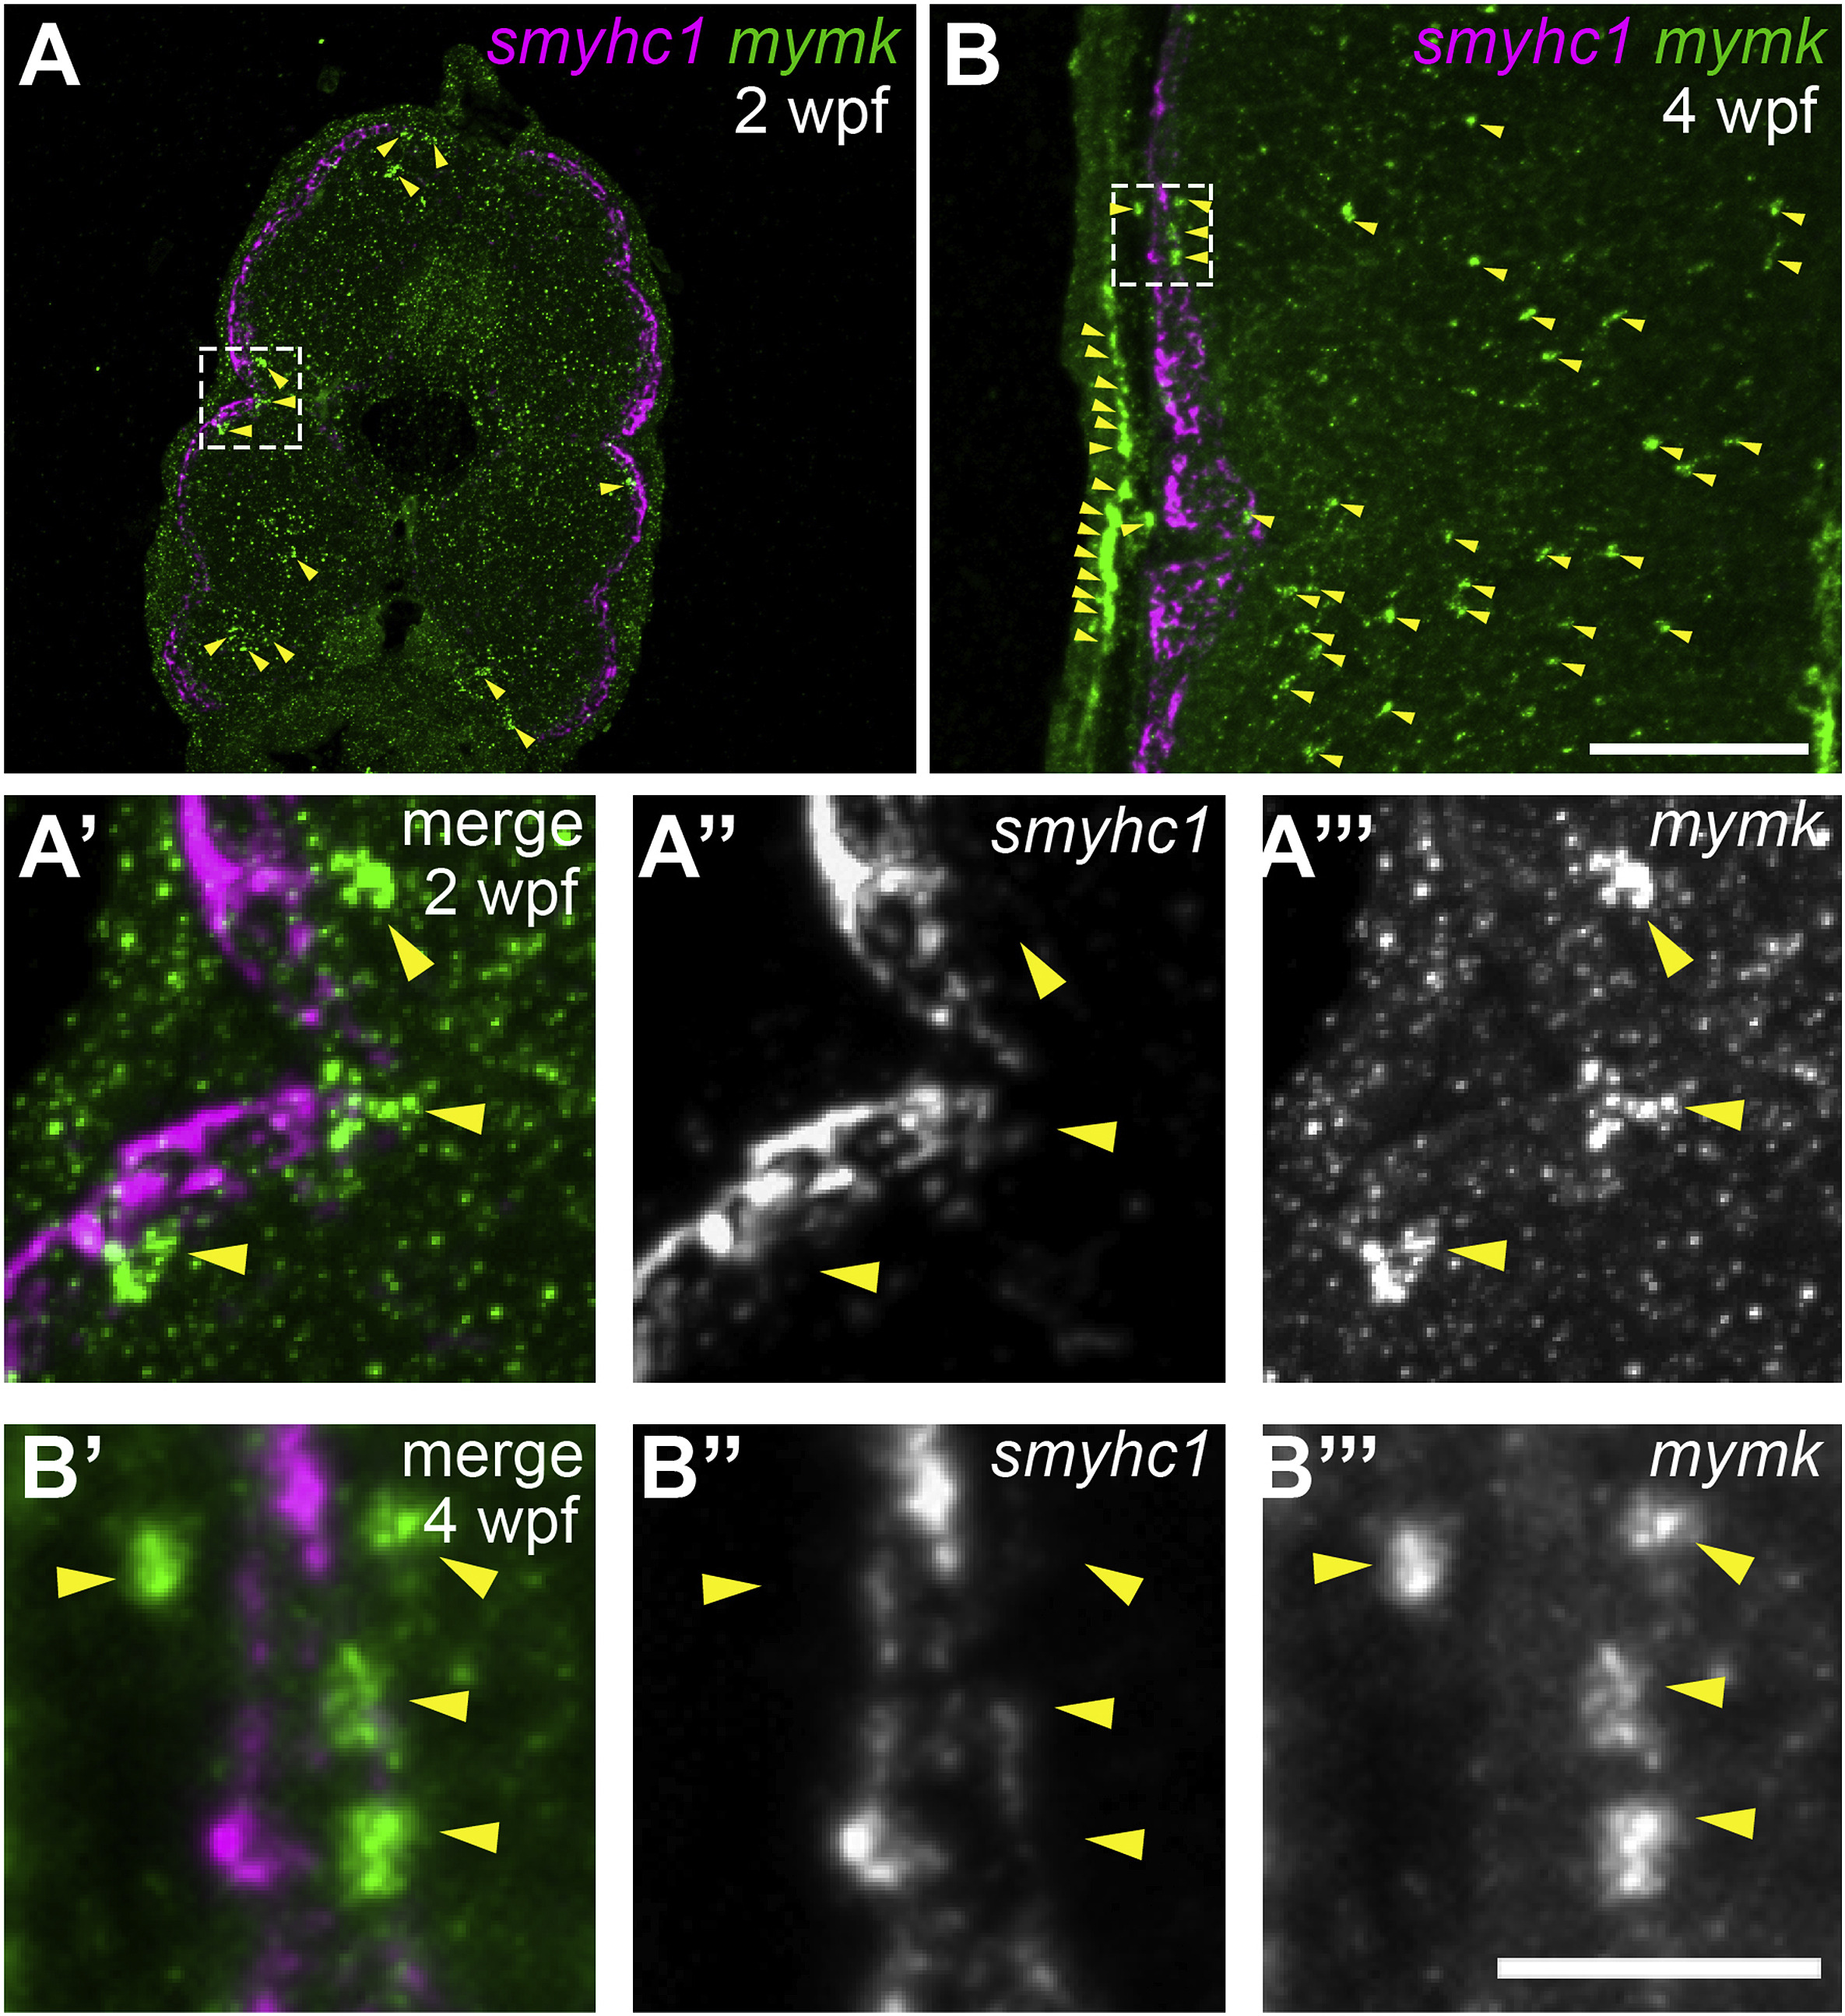
Fig. 8 As slow muscle fusion ensues, mymk is expressed in cells near myofibers, but not in myofibers themselves. (A–B) Transverse sections of wild-type larvae at 2 weeks post fertilization (wpf) (A) and 4 wpf (B), processed by fluorescent in situ hybridization (FISH) to detect smyhc1 (magenta) and mymk (green) transcripts; arrowheads (yellow) indicate a subset of the mymk-positive cells. Magnified images (A′ and B′) of boxed regions in A and B show that smyhc1 (A″ and B″) and mymk (A‴ and B‴) are expressed in distinct cell types at both time points. Scale bar in B (for A, B) is 100 μm and in B‴ (for A′-B‴) is 25 μm.
Reprinted from Developmental Biology, 462(1), Hromowyk, K.J., Talbot, J.C., Martin, B.L., Janssen, P.M.L., Amacher, S.L., Cell fusion is differentially regulated in zebrafish post-embryonic slow and fast muscle, 85-100, Copyright (2020) with permission from Elsevier. Full text @ Dev. Biol.