
|
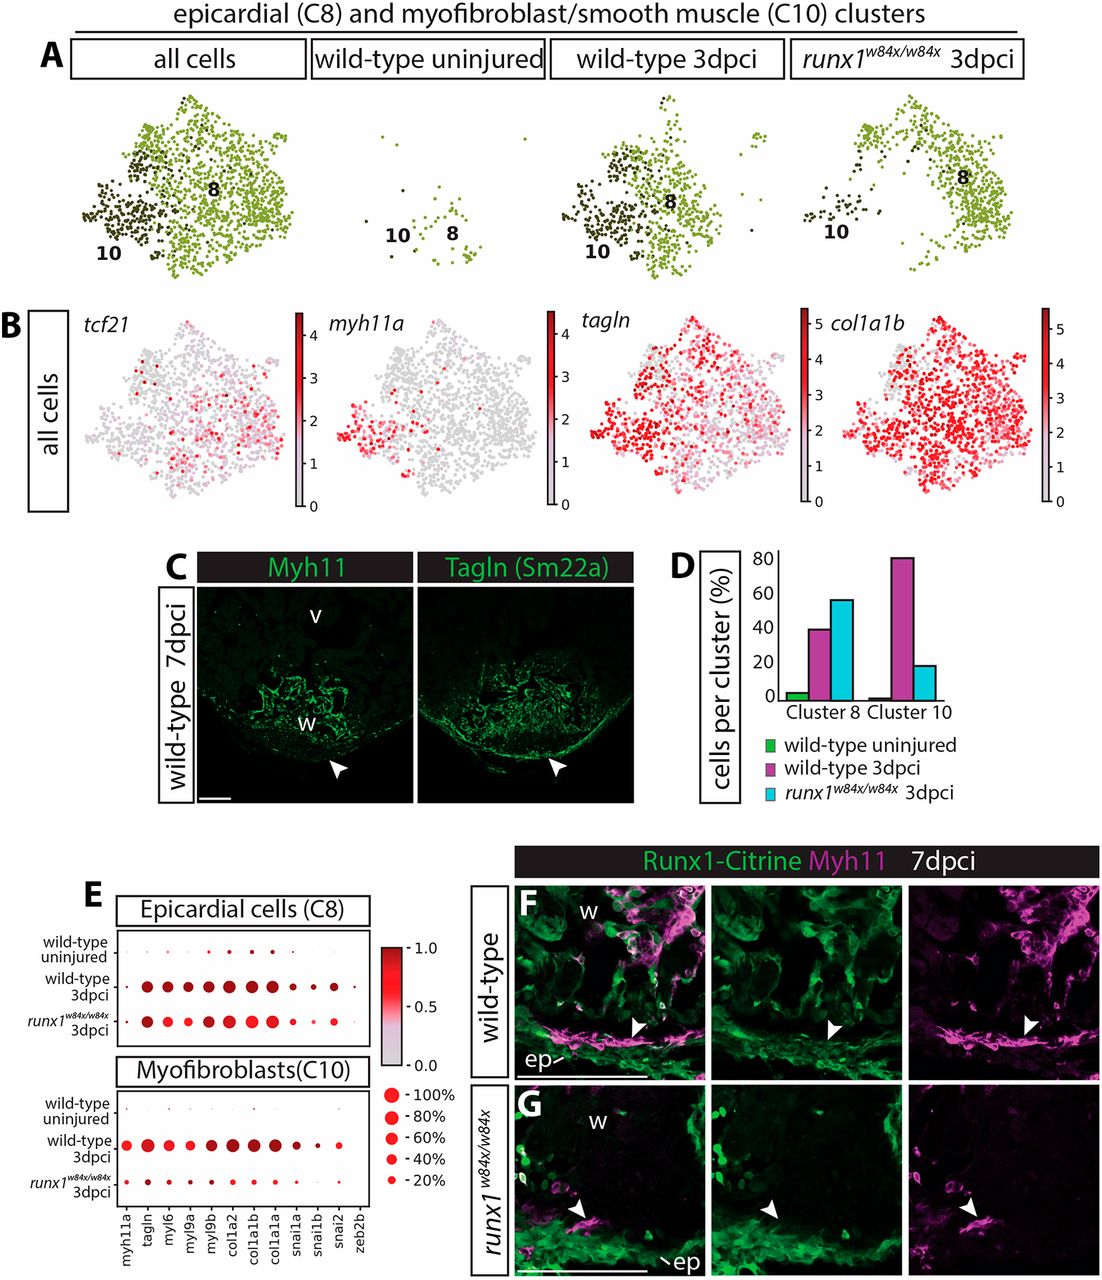
Fig. 9 Reduction in myofibroblast numbers in the runx1 mutant. (A) UMAP plot combining cluster 8 and 10 from Fig. 4B, showing very few cells in these clusters in the uninjured wild type, but the appearance of both populations after injury in the wild type and runx1 mutant. (B) UMAP plot from A, indicating expression levels of tcf21, myh11a, tagln and col1a1b. The epicardial cluster 8 expresses tcf21, whereas myofibroblast cluster 10 expresses myh11a. Both clusters express tagln and col1a1b. (C) Staining of 7 dpci sections confirms presence of Tagln and absence of Myh11 in the epicardium (arrowheads). (D) Single cell data showing the numbers of cells per cluster per sample. Increased number of epicardial cells and a reduced number of myofibroblast cells in the runx1 mutant compared with the wild type. (E) Dotplot showing expression levels of smooth muscle, EMT and collagen genes per sample in clusters 8 and 10. Increased cell numbers and expression of myofibroblast genes in both the epicardial and myofibroblast clusters in the injured wild-types compared to the uninjured wild-types. Epicardial myofibroblast gene expression is lower in the runx1 mutant compared to the uninjured wild-type, while the number of myofibroblast cells is strongly reduced in the mutant. (F,G) Immunohistochemistry for Citrine and Myh11 on 7 dpci sections. Analysis of Myh11 on 7 dpci sections confirmed the reduction in myofibroblast cell numbers close to the epicardium (arrowheads). ep, epicardium; v, ventricle; w, wound. Scale bars: 100 μm.