
|
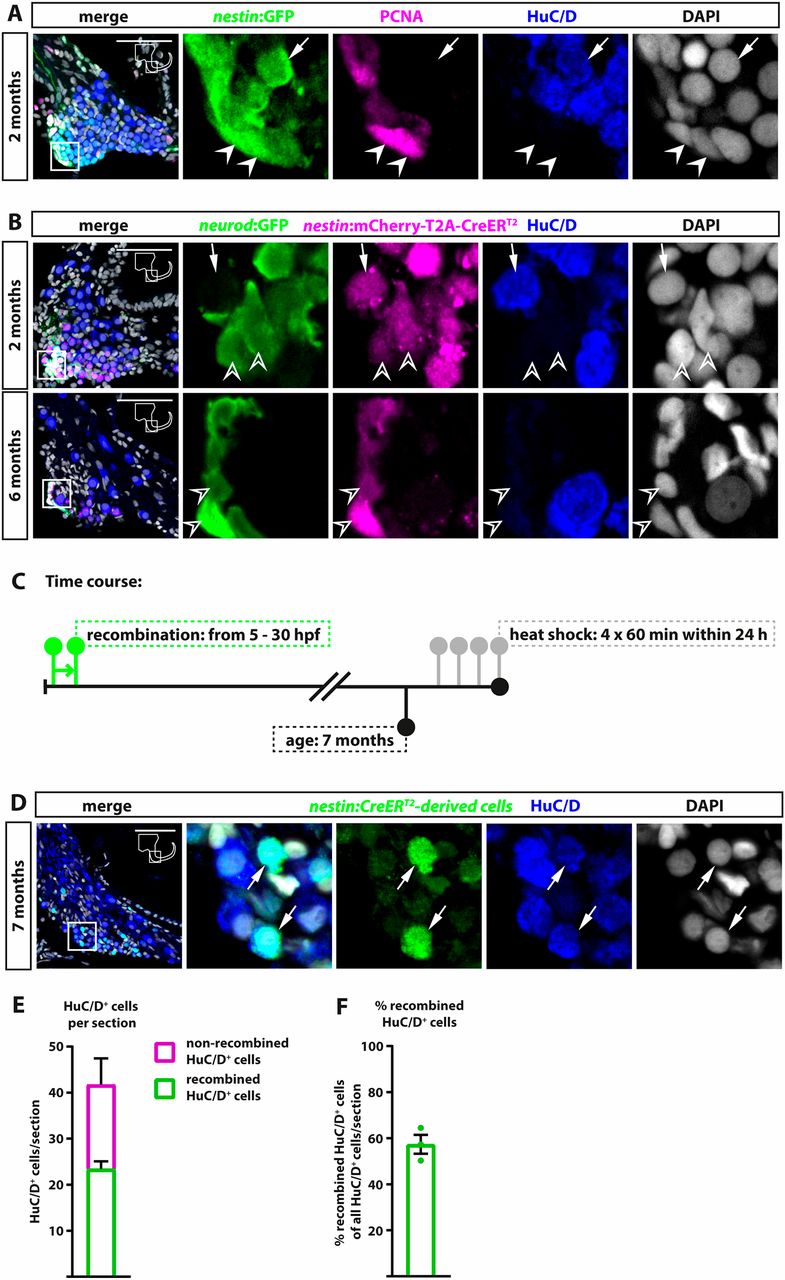
Fig. 6 Nestin expression labels embryonic neuronal progenitors and overlaps with neurod:GFP expression at juvenile and adult stages. (A) Antibody staining showing nestin:GFP expression in the region of the neurod:GFP-positive cells. nestin:GFP-positive cells are proliferating (nestin:GFP/PCNA-positive cells, solid arrowheads) and differentiate into neurons (nestin:GFP/HuC/D-positive cells, arrows) in 2-month-old zebrafish. (B) nestin:mCherry-T2A-CreERT2 is expressed in the neurod:GFP-positive progenitor pool (open arrowheads) in 2- and 6-month-old zebrafish; expression of nestin:mCherry-T2A-CreERT2 persists longer in newly differentiated neurons than neurod:GFP expression (arrows). (C) Time course of nestin:mCherry-T2A-CreERT2 long-term lineage tracing experiment. Recombination in Tg(nestin:mCherry-T2A-CreERT2), Tg(hsp70l:loxP-DsRed2-loxP-nlsEGFP) double-transgenic embryos was induced from 5-30 hpf. At 7 months, zebrafish were heat shocked four times within 24 h to activate the reporter and afterwards analyzed for nestin:CreERT2-derived cells. (D) Co-staining of GFP-positive nestin:CreERT2-derived cells with HuC/D shows the presence of nestin:CreERT2-derived/HuC/D-positive cells (arrows). (E,F) Quantification of GFP-positive (recombined) and GFP-negative (non-recombined) HuC/D-positive cells (E) and percentage of recombined HuC/D-positive cells (F). Panels on right show magnification of boxed areas in left panels. Scale bars: 50 µm. Cross-sections show dorsal to the top and lateral to the right. Quantification: n=3 (n=fish; 1 SAG/fish; 12 sections/SAG); data are presented as mean±s.e.m.