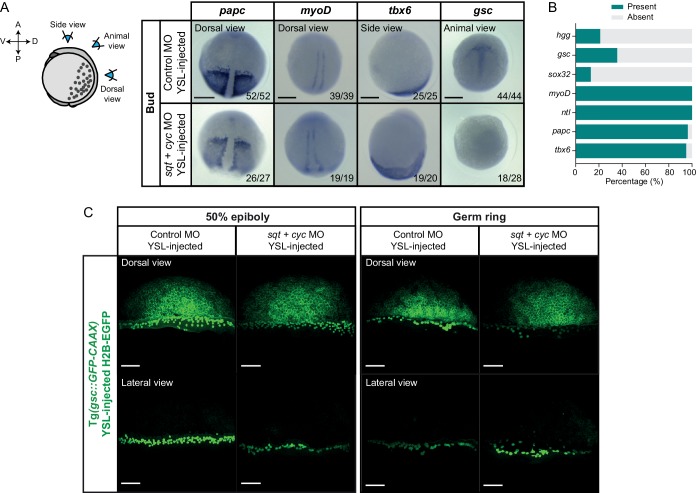
Mesendoderm patterning in embryos with reduced YSL-derived Nodal signals.
(A) Expression of additional mesendoderm marker genes (papc, myoD, tbx6 and gsc) as determined by whole mount in situ hybridization in control MO (6 ng) or sqt (2 ng) + cyc (4 ng) MO YSL-injected embryos at bud stage. Schematic representation of the embryo views is shown in the left. The proportion of embryos with a phenotype similar to the images shown is indicated in the lower right corner (papc: control, n = 52, N = 3, sqt/cyc, n = 27, N = 3; myoD: control, n = 39, N = 3, sqt/cyc, n = 19, N = 3; tbx6: control, n = 25, N = 3, sqt/cyc, n = 20, N = 3 and gsc: control, n = 44, N = 3, sqt/cyc, n = 28, N = 3). (B) Percentage of bud stage sqt (2 ng) + cyc (4 ng) MO YSL-injected embryos showing expression of mesendoderm (hgg: n = 57, N = 4; gsc: n = 28, N = 3; myoD: n = 19, N = 3; ntl: n = 28, N = 4; papc: n = 27, N = 3; tbx6: n = 20, N = 3) and endoderm (sox32: n = 23, N = 3) marker genes, as determined by whole mount in situ hybridization. (C) High-resolution images of control MO (6 ng) or sqt (2 ng) + cyc (4 ng) MO YSL-injected embryos expressing gsc::GFP-CAAX and H2B-EGFP (injection control) at 50% epiboly (dorsal domain: control, n = 10, N = 4; sqt/cyc, n = 7, N = 4; lateral domain: control, n = 9, N = 4; sqt/cyc, n = 7, N = 4) and germ ring (dorsal domain: control, n = 7, N = 4; sqt/cyc, n = 8, N = 4; lateral domain: control, n = 8, N = 4; sqt/cyc, n = 7, N = 4). The position along the dorsal-ventral axis is indicated at the top. Images correspond to the embryos shown in Figure 5C. Scale bars: 200 µm (A), 100 µm (C).
Mesendoderm patterning in embryos with reduced YSL-derived Nodal signals.
Acknowledgments
This image is the copyrighted work of the attributed author or publisher, and
ZFIN has permission only to display this image to its users.
Additional permissions should be obtained from the applicable author or publisher of the image.
Full text @ Elife
Your Input Welcome
Thank you for submitting comments. Your input has been emailed to ZFIN curators who may contact you if
additional information is required.
Oops. Something went wrong. Please try again later.