
|
Figure 2
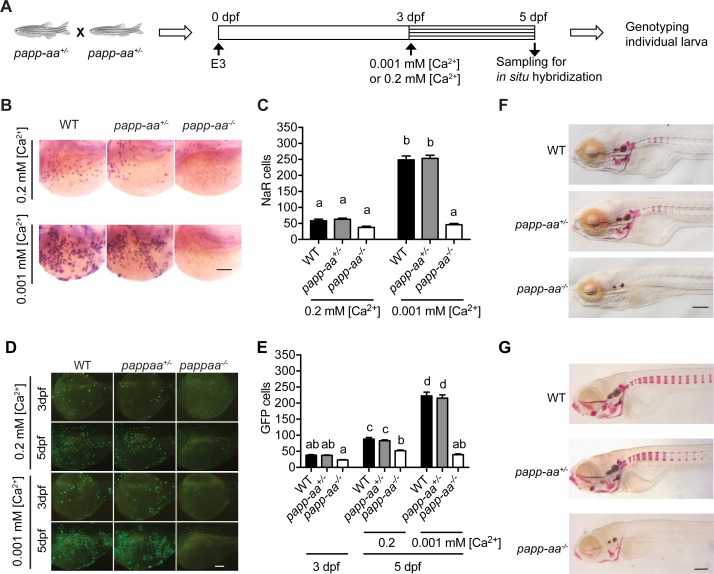
Genetic deletion of papp-aa impairs NaR cell reactivation and bone calcification.
(A) Diagram of the experimental design. Progeny of papp-aa+/- fish intercrosses were raised in standard E3 embryo medium to three dpf. The progeny is a mixture of homo, hetero, and wild type embryos. They were transferred to the low [Ca2+] (0.001 mM) or normal [Ca2+] (0.2 mM) embryo medium at three dpf. Two days later, NaR cells in each fish were detected by igfbp5a mRNA expression and quantified. These fish were genotyped individually afterwards. (B–C) Progeny of papp-aa+/- intercrosses were treated as described in (A). Representative images are shown in (B) and quantified data in (C). Scale bar = 0.1 mm. n = 10 ~ 30 fish/group. In this and all subsequent figures, data shown are Mean ± SEM. Different letters indicate significant differences among groups by one-way ANOVA followed by Tukey’s multiple comparison test (p<0.05). (D–E) Progeny of papp-aa+/-;Tg(igfbp5a:GFP) fish intercrosses were raised in E3 medium to three dpf and transferred to the low [Ca2+] (0.001 mM) or normal [Ca2+] (0.2 mM) embryo medium. Two days later, the number of GFP-expressing NaR cells in each larva was quantified. The larvae were genotyped individually subsequently. Representative images are shown in (D) and quantified data in (E). Scale bar = 0.1 mm. n = 16 ~ 82 fish/group. (F–G) Fish of the indicated genotypes were raised in E3 embryo medium to 7 dpf and 12 dpf and stained with Alizarin Red. Scale bar = 0.2 mm.