
|
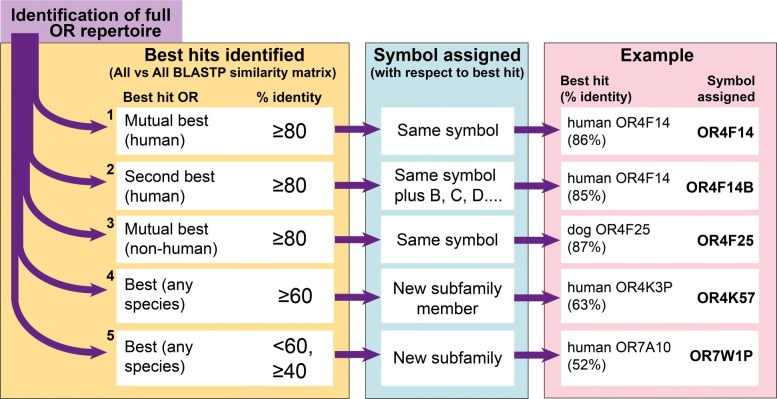
Fig. 1
The MMS algorithm. A diagram illustrating the workflow of hierarchical symbol assignment with the MMS algorithm. After identification of the full OR repertoire in a given species, all vs all BLASTP similarity matrices are generated against the OR repertoires of human and other mammals whose repertoires have been classified. The classification criteria (highlighted in the left-hand yellow box), numbered 1–5, are applied in a stepwise fashion: genes that fail to pass the cutoff in step 1 are passed to step 2, and so on. Symbols are assigned based on the best hits as shown in the middle (blue) box. Examples of cow OR symbols at each classification step are shown in the right-hand (pink) box