
|
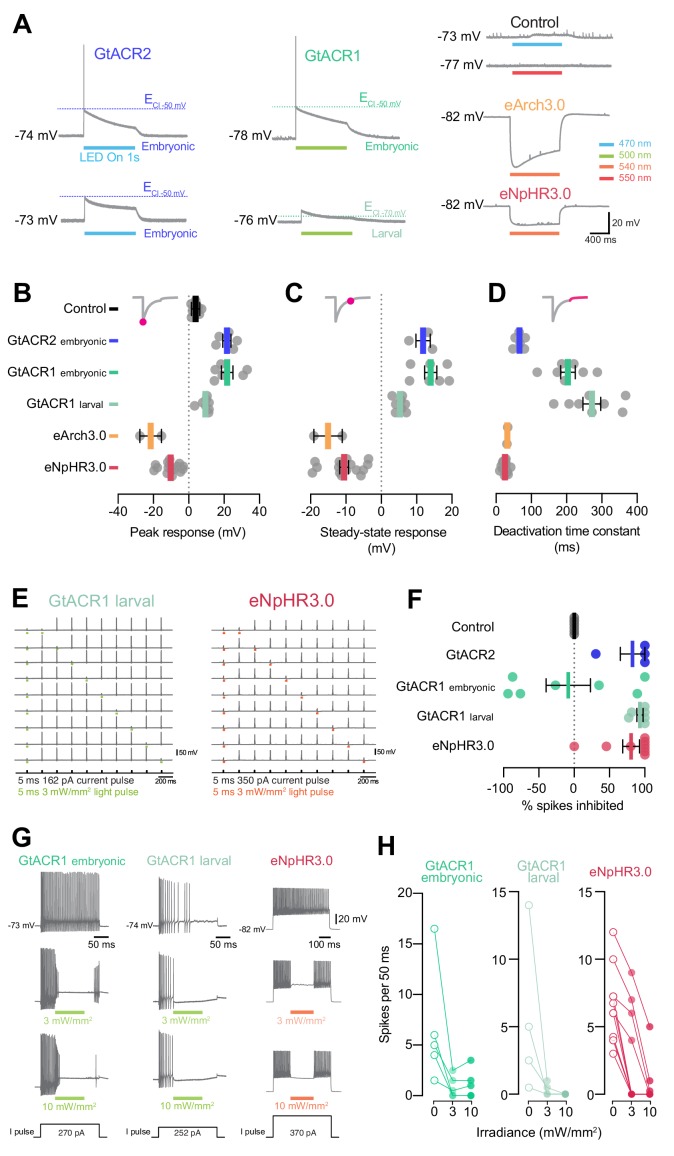
Figure 9. (A) Example voltage deflections induced by anion channelrhodopsins and Cl–/H+ pumps in response to a 1 s light pulse (20 mW/mm2). (B–D) Peak (B) and steady-state (C) responses and deactivation time constant (D) of voltage deflections. All opsins induced similar absolute voltage changes. Anion channelrhodopsins generated depolarisation with both intracellular solutions while Cl–/H+ pumps generated hyperpolarisation. (E) Example recordings demonstrating inhibition of single spikes in GtACR1- and eNpHR3.0-expressing cells with 5 ms light pulses (3 mW/mm2). (F) Fraction of spikes that were optogenetically inhibited (mean ± SEM, across cells). All opsins achieved high suppression efficacy, but GtACR1 induced additional spikes upon light delivery with the embryonic intracellular solution. (G) Example recordings demonstrating inhibition of sustained spiking in GtACR1- and eNpHR3.0-expressing cells. (H) Quantification of suppression using protocol illustrated in (G). Number of spikes per 50 ms during light delivery (0–10 mW/mm2) is plotted against irradiance. GtACR1 and eNpHR3.0 inhibited tonic spiking with similar efficacy (mean ± SEM). See also Figure 9—figure supplement 1.